• The Forex, Binary Options Forum - welcomes you to our Community!

    DigitalCashPalace Forum is dedicated to discussions about Forex, Binary Options, commodities, stocks related.

    Please take a look around, and feel free to .

Forex Analysis by LiteForex

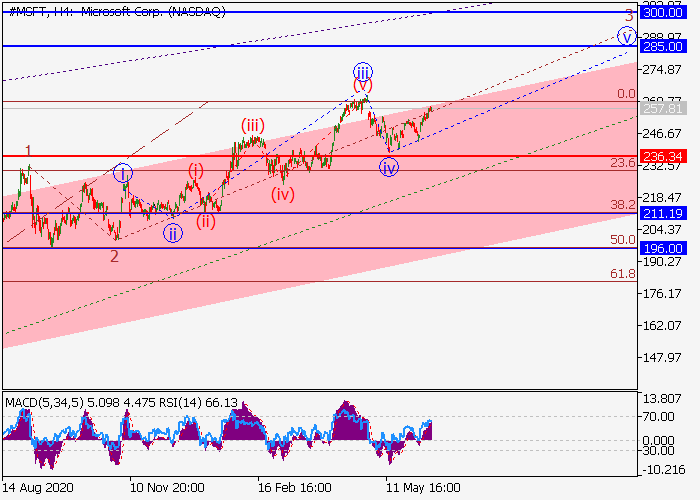
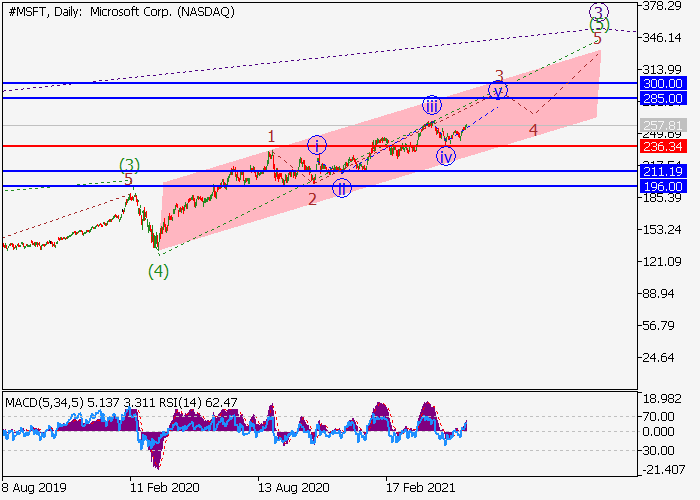
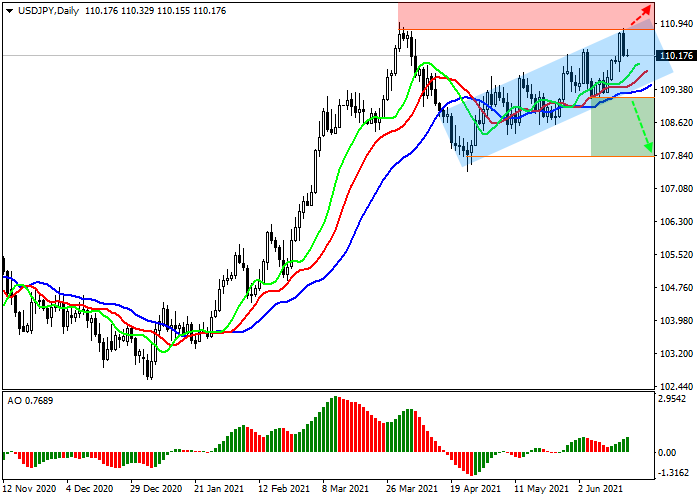
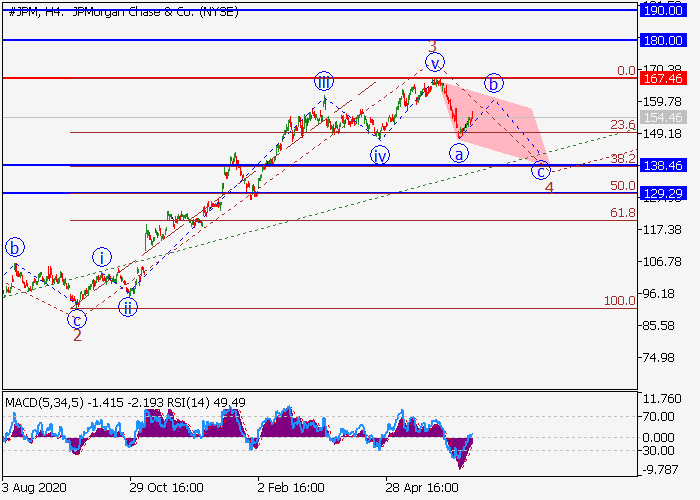
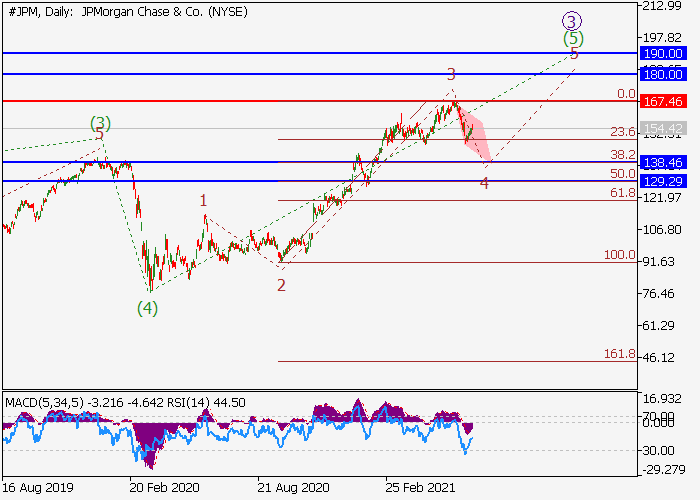
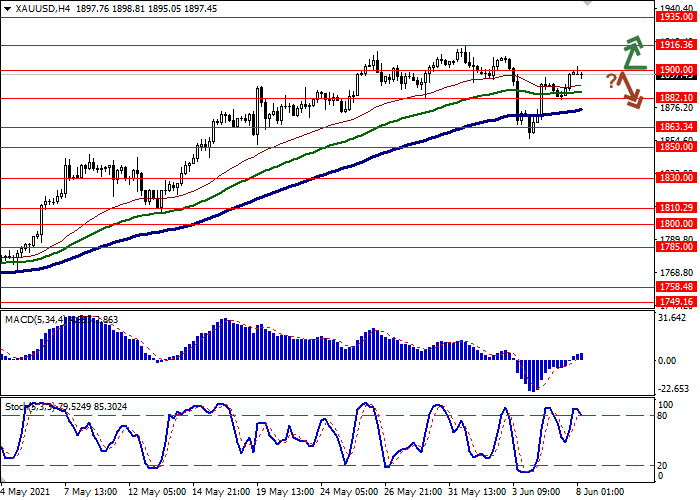
XAU/USD: gold is consolidating near 1900.00 again

Current trend

Gold prices are consolidating near 1900.00 in the morning session after a moderate increase the day before, which was supported by the weakness of USD. The US currency remains under significant pressure after last Friday's US labor market report for May reflected slower-than-expected growth in Nonfarm Payrolls.

This week, traders are awaiting the publication of data on the dynamics of consumer inflation in the US in order to try to put together the big picture and predict the course of monetary policy from the US Fed. It is likely that the American regulator will again maintain a wait-and-see attitude, saying that inflation is facilitated by the active period of economic recovery after the pandemic.

Support and resistance

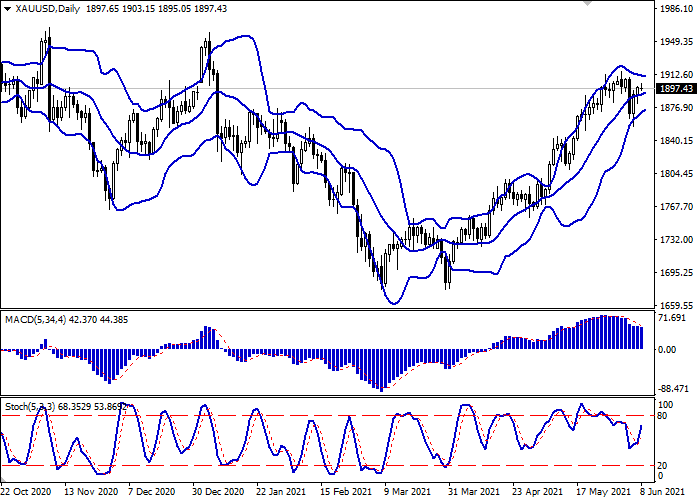
Bollinger Bands are showing insignificant growth on the daily chart. The price range is narrowing from below, indicating a multidirectional nature of trading in the short term. The MACD indicator is going down, maintaining a weak sell signal (the histogram is below the signal line). Stochastic, on the other hand, maintains a confident upward direction and is rapidly approaching its highs, which indicates the risks of an overbought instrument in the ultra-short term.

Existing long positions should be held until the signals from technical indicators are clarified.

Resistance levels: 1900.00, 1916.36, 1935.00, 1952.53.

Support levels: 1882.10, 1863.34, 1850.00, 1830.00.

c7b4c88fcdc3bf9eee4562f6f5e49728.png


3f44c23d7f594fad6ac74e551cf72322.png
 
WTI Crude Oil: oil renews record highs

Current trend

Today, during the Asian session, prices for WTI Crude Oil are growing moderately, consolidating above the psychological level of $70 per barrel.

Positive dynamics are taking place against a certain lull in the market, as investors prefer to wait for the appearance of a block of macroeconomic statistics on US consumer inflation. Next week, the next meeting of the US Federal Reserve System will take place, at which, as some experts expect, preliminary discussions of a gradual tightening of monetary policy in the country may begin.

Additional support for the instrument was provided by the API report on oil reserves in American warehouses published on Tuesday. For the week of June 4, oil reserves decreased by 2.108M barrels after falling by 5.36M barrels over the previous period. Markets are awaiting the release of the final report on oil reserves from the US Department of Energy on Wednesday. Forecasts assume a decline of 3.576M barrels after a decrease of 5.08M barrels earlier.

Support and resistance

Bollinger bands grow steadily on the daily chart. The price range actively decreases, indicating the risks of the instrument being overbought in the nearest time intervals. MACD grows, maintaining a strong buy signal (the histogram is above the signal line). Stochastic, having approached its highs, reversed into a horizontal plane, signaling that the instrument is overbought in the ultra-short term.

It is better to keep current long positions until the signals from technical indicators are clarified.

Resistance levels: 71.00, 71.80, 73.00.
Support levels: 70.00, 69.08, 68.15, 67.00, 65.74.

6a296a53fa0cc1b94b8980bbe738e1a8.png


e00560cf7304e8169afcd33d72901472.png
 
Altria Group Inc.: wave analysis

The price may grow.

On the daily chart, the first wave of the higher level (1) develops, within which the wave 3 of (1) forms. Now, the third wave of the lower level iii of 3 has formed, a local correction has ended as the fourth wave iv of 3, and the wave v of 3 is developing. If the assumption is correct, the price will grow to the levels of 55.00–57.50. In this scenario, critical stop loss level is 45.22.

1bbacfd30e989bd34f332cd5612e0e3c.png


c5aaf49b1bf39ef5b61934da87e5f021.png
 
Microsoft Corp.: wave analysis

The price may grow.

On the daily chart, the fifth wave of the higher level (5) of 3 develops, within which the wave 3 of (5) forms. Now, the third wave of the lower level iii of 3 has developed, a local correction has formed as the fourth wave iv of 3, and the development of the fifth wave v of 3 has started. If the assumption is correct, the price will grow to the levels of 285.00–300.00. In this scenario, critical stop loss level is 236.34.

d2e1a1181bdb420348d8c5aa96cb67d9.png


6c6da26afaa4ab15139d1132806dd2de.png
 
USD/CHF: waiting for the US-Russia presidents’ summit

Current trend

The USD/CHF pair grows due to a slight USD increase, trading at the level of 0.8993.

Tomorrow in Geneva, within the framework of the Russia-US summit, a personal meeting of Presidents Vladimir Putin and Joe Biden will be, where the parties, among other issues, will discuss the prospects for the development of bilateral relations. Before it, the volatility in the global markets dropped significantly, and the main instruments move without a pronounced trend. CHF is at the levels of the beginning of the week and did not react in any way to yesterday's May PPI, which rose by 0.8% MoM and by 3.2% YoY.

USD Index moves in an extremely narrow sideways channel around 90.500, which is the upper border of a wide channel that has been forming for almost a month. Also to the upcoming talks in Geneva, investors are looking forward to today's release of US retail sales data for May, which could decline by 0.7%. On Tuesday, there are also data on industrial production, which are not expected to change. In general, no serious instrument movement before the start of the summit is expected, and the USD/CHF pair may continue trading at current levels.

Support and resistance

Globally, the price corrects upwards. Technical indicators keep a sell signal but reflect a correction: Alligator indicator’s EMA fluctuations range narrows, and the AO oscillator histogram, being in the sell zone, approaches the transition level.

Resistance levels: 0.9036, 0.9138.
Support levels: 0.8930, 0.8829.

8ab7cdca75af646afa9343a04ca185fd.png
 
JP Morgan Chase Co.: wave analysis

The price is in a correction, a fall is possible.

On the daily chart, the fifth wave of the higher level (5) forms, within which the wave 3 of (5) ended. Now, a downward correction has started to develop as the fourth wave 4 of (5). If the assumption is correct, the price will fall to the levels of 138.46–129.29. In this scenario, critical stop loss level is 167.46.

6f25bbdf2f0544d19f40af08e08dfd3c.png


e524947704c1ac8e7adc9ab19e794b41.png
 
American Express Co.: wave analysis

The price may grow.

On the daily chart, the fifth wave of the higher level (5) develops, within which the wave 3 of (5) forms. Now, the fifth wave of the lower level v of 3 is developing. If the assumption is correct, the price will grow to the levels of 180.00–190.00. In this scenario, critical stop loss level is 150.80.

7a17edf68852313c255eddb67fe107b0.png


db7fe9f4d6a04df910e9cedcd045f9d4.png
 
USD/JPY: the yen leads against the dollar again

Current trend

The USD/JPY pair moves ambiguously, trading around the level of 110.16.

JPY took the lead in the instrument after the Bank of Japan meeting on monetary policy ended this morning. As expected by most experts, all parameters were almost unanimously extended for the next 6 months. The interest rate will remain at –0.10%, and the program for the purchase of exchange-traded funds and trusts (J-REIT) has been extended with an upper limit of about 12T yen. Until March 2022, the bank will buy corporate bonds with an upper limit of up to 20T yen. The regulator's actions were expected, as economic activity in Japan is still at extremely low levels.

As for the American economy, the pace of recovery remains strong but the country has not been able to solve its most important problem – the decline in the labor market. Initial jobless claims were significantly higher than forecast again. Analysts had expected a reduction to 359K but the figure rose to 412K, and the total number of beneficiaries rose to 3.518M from 3.430M a week earlier. So, the labor market is the main deterrent to USD strengthening.

Support and resistance

The price moves within the ascending channel. Technical indicators keep a buy signal: the range of fluctuations in the EMA on the Alligator indicator is directed upwards, and the histogram of the AO oscillator is above the zero line.

Support levels: 109.22, 107.83.
Resistance levels: 110.75, 112.00.

8f2ec992803bdc34ef8fb3b1994a5a86.png
 
Walt Disney Co.: wave analysis

The price may grow.

On the daily chart, a downward correction of the higher level developed as the fourth wave (4), and the fifth wave (5) develops. Now, the third wave of the lower level 3 of (5) has formed, a downward correction has ended as the wave 4 of (5), and the development of the wave 5 of (5) has started, within which the wave i of 5 is forming. If the assumption is correct, the price will grow to the levels of 202.98–220.00. In this scenario, critical stop loss level is 166.66.

17d88b9dbce6a276b67378ce62906ebf.png


c9c5bfccf84bda51e5e095a8d09dc5a4.png
 
Brent Crude Oil: prospects for demand growth support quotes

Current trend

Benchmark Brent crude prices are on the upward trend amid rising global energy demand, trading around $75.00 per barrel. Last week, the instrument was pressured by the expectation of an inflow of Iranian oil to the market; however, after the slowdown in negotiations on the "nuclear deal", the total volume of demand began to significantly exceed supply, which allows the "black gold" rate to adjust upward. A positive point is the significantly increased consumption of petroleum products due to the prevalence of road transport in the world over the rest since most of the borders are closed for air travel.

Paying attention to the main world arbitrage position of the spread between Brent Crude Oil and WTI Crude Oil, the range of fluctuations has narrowed significantly and is currently only $1.70, which is the lowest indicator since the price collapse in the summer of 2018. This fact suggests that the implementation of a large position is being prepared.

Support and resistance

On the global chart, the asset is moving within an uptrend. Technical indicators maintain a stable buy signal: Alligator indicator’s EMA fluctuations range expands upward, while the AO oscillator histogram remains high in the positive zone.

Resistance levels: 76.00, 78.00.
Support levels: 72.00, 65.00.

ebaff57f043c0c61c9d04319cfc7a250.png
 
USD/CAD: wave analysis

The pair is in a correction and may grow.

On the daily chart, the downward wave of the higher level (C) of 4 develops, within which the third wave 3 of (C) formed. Now, an upward correction is developing as the fourth wave 4 of (C), within which the wave a of 4 has formed, and the wave b of 4 is developing. If the assumption is correct, after the end of the correction, the pair will grow to the levels of 1.2537–1.2716. In this scenario, critical stop loss level is 1.2194.

e0a1b9ab9c21d24894040495ee9b70e4.png


b9efe8fda67f8d9f0c95f5defd9ffce5.png
 
Alibaba Group Holdings Ltd.: wave analysis

The price may fall.

On the daily chart, the first upward wave of the higher level 1 developed, and a downward correction forms as the wave 2. Now, the wave (C) of 2 is forming, within which the third wave of the lower level 3 of (C) has formed, and a local correction is developing as the wave 4 of (C). If the assumption is correct, after the end of the correction, the price will fall to the levels of 187.27–155.97. In this scenario, critical stop loss level is 245.00.


06e0a595add2d84b5c6b0234e22240c4.png


11f876e69fcc4bf70d8020ab44726660.png
 
It’s so cool to see how the yen takes the lead against the USD in the market. Able to see how the currency trends with respect to important economic events.
 
GBP/USD: Bank of England is not ready to change the course of monetary policy

Current trend

The GBP/USD pair moves horizontally, trading around the level of 1.3930 amid the rhetoric of the Bank of England.

GBP reacted neutrally to the regulator's decision not to change the main parameters of monetary policy and leave the interest rate at 0.10%, and the total volume of the government bond purchase program at 875B pounds. Officials of the department stressed that at the moment the priority is to achieve a stable inflation range above 2%, mainly due to a possible further increase in energy prices. The bank also drew attention to GDP growth rates, which are still below the benchmarks, and set a target range of around 5.5% for the third quarter.

The US macroeconomic statistics were also viewed as neutral by investors. Although Initial Jobless Claims were higher than the forecast, amounting to 411K against 380K expected, USD rate remained at the level of the beginning of the week. Among the negative indicators, it is worth noting the decrease in durable goods orders for May to 0.3% from 1.7% for April. Now, it seems that the overpriced dollar is being held artificially, and in case of further deterioration of the quotes, the quotes may start to actively decline.

Support and resistance

The course moves within a wide lateral channel. Technical indicators keep a local sell signal: fast EMAs on the Alligator indicator are below the signal one, and the AO oscillator histogram is kept in the sell zone.

Resistance levels: 1.3985, 1.4221.
Support levels: 1.3788, 1.3668.


37d6114520a9ccb12aba15772eb0317e.png
 
USD/CAD: in anticipation of new growth drivers

Current trend

After a decline at the end of last week, today during the Asian session, the USD/CAD pair grows slightly, adding about 0.11% and trying to consolidate above the psychological level of 1.2300.

Investors are assessing the prospects for tightening the monetary policy of the US Federal Reserve in the light of the approval in Congress of a new plan to modernize the US infrastructure in the amount of almost $600B. The regulator was previously in no hurry to raise interest rates, so now analysts expect him to take even more measured actions.

On Monday, traders expect statements from two representatives of the US Federal Reserve, John Williams and Randal Quarles, who are likely to express their views on the timing of tightening monetary policy and the rate of inflation in the country.

Support and resistance

Bollinger bands are actively growing on the daily chart. The price range is narrowing from below, reflecting the emergence of multidirectional trading dynamics in the short term. The MACD indicator is going down, maintaining a poor sell signal (the histogram is below the signal line). Stochastic, having approached the level of 20, reversed into a horizontal plane, reacting to the flat nature of the trades of the last days.

It is better to wait for the clarification of signals from technical indicators to open new positions for the instrument.

Resistance levels: 1.2300, 1.2352, 1.2400, 1.2439.
Support levels: 1.2245, 1.2200, 1.2143, 1.2060.


07efba9a12326baa4343ac74196128af.png


b9594a21bd3a62a6fa456b4d9f228d1a.png
 
USD/CHF: USD is recovering

Current trend

USD has seen moderate gains against CHF during the Asian session, testing the resistance at 0.9200.

Investors are in no hurry to open new trading positions, preferring to wait for additional drivers to appear on the market. The focus is on the June report on the US labor market, which will assess the prospects for tightening the US Fed's monetary policy. The ADP Employment Change is due tomorrow, setting the tone for end-of-week expectations. Current forecasts are pretty pessimistic. The US economy is expected to create only 600K new private sector jobs in June, significantly less than the nearly 1M jobs created in May.

The market also expects the publication of data on jobless claims on Thursday. It is assumed that for the week ending June 25, the number of Initial Jobless Claims will show a decrease from 411K to 393K. The number of Continuing Jobless Claims for the week ending June 18 may be reduced from 3.39M to 3.382M.

Support and resistance

Bollinger Bands in D1 chart show active growth. The price range is narrowed from below, being spacious enough for the current activity level in the market. MACD indicator is growing preserving a weak buy signal (located above the signal line). Stochastic, interrupting its active decline last week, reversed upwards, indicating the prospects for growth in the instrument in the nearest time intervals.

Resistance levels: 0.9200, 0.9237, 0.9300, 0.9350.
Support levels: 0.9153, 0.9100, 0.9050, 0.9000.


8b16327a842653b35b0d4902c78c303f.png


2915a12bd1aba3045fd90dc3c149a051.png
 
JP Morgan Chase Co.: wave analysis

The price is in a correction, a fall is possible.

On the daily chart, the fifth wave of the higher level (5) forms, within which the wave 3 of (5) ended. Now, a downward correction is developing as the fourth wave 4 of (5), within which the wave a of 4 has formed. If the assumption is correct, after the end of the correction b of 4 the price will fall to the levels of 138.46–129.29. In this scenario, critical stop loss level is 167.46.


0ecae3614c8c1df352b8e0edbf3f6fb7.png


a8197406e4825b21628c7c087468242b.png
 
WTI Crude Oil: consolidation near record highs

Current trend

The prices for WTI Crude Oil show near-zero dynamics, holding close to record highs and the level of $74 per barrel. The quotes are still moderately supported by the fact that the oil stocks in US warehouses are declining. At the same time, data from OPEC indicate a growing oil shortage in the market, in connection with which the cartel may decide to increase quotas for oil production. The next meeting of the organization should take place today.

As the report from the US Department of Energy published yesterday showed, stocks of oil and petroleum products in the country for the week of June 25 decreased by 6.718M barrels after falling by 7.614M barrels over the previous period. Analysts' forecasts assumed a decrease in reserves by only 4.686M barrels. At the same time, gasoline inventories rose again by 1.5M to 241.6M barrels, while experts expected a reduction of 1.2M barrels.

Support and resistance

On the daily chart, Bollinger bands are rising moderately. The price range is inclined to reverse into a horizontal plane, reacting to the flat nature of the trades of the last days. The MACD indicator is going down, maintaining a poor sell signal (the histogram is below the signal line). After a short decline, Stochastic is trying to reverse upwards again, reflecting the appearance of the “bullish” impulse on Tuesday.

Resistance levels: 74.00, 75.00, 75.68.
Support levels: 73.00, 71.80, 71.00, 70.00.

c311719ec82cf4fc8822f42877067db1.png


2a8b1cc9e4b127210985e6604ca3393e.png
 
USD/JPY: USD updates record highs

Current trend

USD has seen slight gains against JPY in Asian trading, hitting record highs since late March 2020. Market activity remains rather low, as traders await the publication of the US employment report, which remained one of the main drivers throughout the week.

The macroeconomic statistics from Japan released the day before managed to support the "bullish" sentiments on JPY for some time, but were unable to reverse the negative trend. Tankan Large Manufacturing Index in Q2 2021 increased from 5 to 14 points, which turned out to be worse than the expected values by 1 point. Tankan Large All Industry Capex for the same period increased from 3% to 9.6%, while the forecast was at 7.2%. Jibun Bank Manufacturing PMI increased from 51.5 to 52.4 points in June.

Support and resistance

Bollinger Bands in D1 chart show stable growth. The price range is expanding but it fails to conform to the surge of "bullish" activity at the moment. MACD indicator is growing preserving a stable buy signal (located above the signal line). Stochastic maintains a confident upward direction, but reaches its highs, which significantly limits the development of "bullish" sentiments in the nearest time intervals.

Resistance levels: 111.70, 112.00, 112.44, 113.00.
Support levels: 111.34, 111.00, 110.81, 110.42.

e3a707b698a75fb5e9b115328ce10a4c.png


bb949600cd4e974011ef288a2a17455f.png
 
USD/CHF: correction after the publication of the report on the labor market

Current trend

Today during the Asian session, the USD/CHF pair slightly grows within the correction, trying to recover from a sharp decline last Friday, which was provoked by the publication of the report on the US labor market for June.

The report reflected an increase in Nonfarm Payrolls by 850K after an increase of 583K for May, although analysts' forecasts assumed an increase in the indicator only to 700K. Nevertheless, the market was covered by a wave of sales of the American currency, as investors secretly counted on much more impressive growth.

On Monday, traders are focused on the statistics on business activity in the service sector and manufacturing in Europe for June. The US will report on the dynamics of business activity only on Tuesday.

Support and resistance

Bollinger bands actively grow on the daily chart. The price range narrows, reflecting the ambiguous short/ultra-short term trading. MACD falls, maintaining a poor sell signal (the histogram is below the signal line). Stochastic, reversed at 80, maintains a fairly confident “bearish” dynamics, signaling in favor of the development of a downtrend in the US currency in the ultra-short term.

The current readings of technical indicators do not contradict the further development of the corrective decline in the nearest time intervals.

Resistance levels: 0.9237, 0.9273, 0.9300.
Support levels: 0.9200, 0.9153, 0.9100, 0.9050.

eaa453b84200e90e82c8cde300117d2b.png


4ef5c67baa04e0aad11051966b77162f.png
 
Top