The December E-mini S&P 500 Index is called mixed-to-higher. Because of the light volume due to the U.S. Bank holiday, there was very little follow-through to the upside following Friday’s spectacular comeback rally. The strong close has the market in a position to test the pair of tops at 1773.25 and 1774.50.
There are no major economic releases today, but Friday’s stronger-than-expected U.S. Non-Farm Payrolls report may continue to influence the trade today. Several issues could lead to a choppy, two-sided trade this week. Firstly, investors are questioning value. This means they may be hesitant about buying strength. Secondly, there is still confusion over the Fed’s plans to begin reducing its monetary stimulus. Some investors believe it will take place as early as December while others have pushed it into April 2014.
This week’s testimonies by Fed Chairman Ben Bernanke and Chairman nominee Janet Yellen may shed a little light on the Fed’s next move. On Wednesday, Bernanke will answer questions from a Senate committee. On Thursday, Yellen will testify before the Senate Banking Committee. This will be part of the confirmation process.
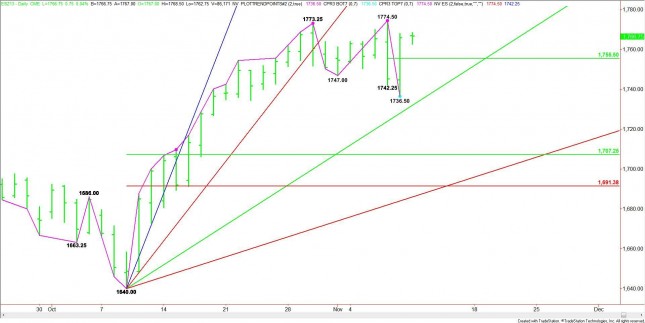
Technically, resistance is a pair of tops at 1773.25 to 1774.50. Both are closing price reversal tops which tend to indicate the selling is greater than the buying at current price levels. Friday produced a closing price reversal bottom, but since the action did not take place following a prolonged move down in price and time, it doesn’t carry as much weight as the tops.
The short-term range is 1774.50 to 1736.50. This makes the pivot at 1755.50 a major support level. How investors react to a test of this level should dictate the tone and direction of the market over the near-term. A sustained move through this level could trigger an eventual move into an uptrending Gann angle at 1732.00.
Traders should watch the volume on a breakout over 1774.50. If the breakout takes place on light volume then look for the rally to fail. Volume should also come into play when 1755.50 is tested. Heavy volume will indicate investors are attacking this level with conviction.
There are no major economic releases today, but Friday’s stronger-than-expected U.S. Non-Farm Payrolls report may continue to influence the trade today. Several issues could lead to a choppy, two-sided trade this week. Firstly, investors are questioning value. This means they may be hesitant about buying strength. Secondly, there is still confusion over the Fed’s plans to begin reducing its monetary stimulus. Some investors believe it will take place as early as December while others have pushed it into April 2014.
This week’s testimonies by Fed Chairman Ben Bernanke and Chairman nominee Janet Yellen may shed a little light on the Fed’s next move. On Wednesday, Bernanke will answer questions from a Senate committee. On Thursday, Yellen will testify before the Senate Banking Committee. This will be part of the confirmation process.
Technically, resistance is a pair of tops at 1773.25 to 1774.50. Both are closing price reversal tops which tend to indicate the selling is greater than the buying at current price levels. Friday produced a closing price reversal bottom, but since the action did not take place following a prolonged move down in price and time, it doesn’t carry as much weight as the tops.
The short-term range is 1774.50 to 1736.50. This makes the pivot at 1755.50 a major support level. How investors react to a test of this level should dictate the tone and direction of the market over the near-term. A sustained move through this level could trigger an eventual move into an uptrending Gann angle at 1732.00.
Traders should watch the volume on a breakout over 1774.50. If the breakout takes place on light volume then look for the rally to fail. Volume should also come into play when 1755.50 is tested. Heavy volume will indicate investors are attacking this level with conviction.