• The Forex, Binary Options Forum - welcomes you to our Community!

    DigitalCashPalace Forum is dedicated to discussions about Forex, Binary Options, commodities, stocks related.

    Please take a look around, and feel free to .

Daily market analysis by NordFX

Julia NordFX

Broker Representative
Generalized Forex Forecast for 25 – 29 July 2016

First, a review of last week’s forecast:


– as to EUR/USD, the majority of experts believed that the pair would continue moving in a sideways channel. This prediction may be deemed as panned out, if we consider the month range of 1.0970–1.1180, at which the pair appeared to stall after Brexit. With this, it should be mentioned that only 25% of analysts predicted that the pair would go down and strive to retest the low of June 24 at the level of 1.0900, and there are only around 50-60 points left before it reaches this level;


– GBP/USD. The powers of bulls and bears turned out to be almost equal, and during the entire week the pair had been fluctuating within 1.3070–1.3290 with the pivot point of 1.3200, which complies with the low of June 24 and which is due to absence of any significant news in respect of Brexit;


– the forecast about acting of USD/JPY was 100% fulfilled. The analysts reckoned that the upward rebound, seen two weeks ago, was only a retracement. In their opinion the pair should change over to the sideways movement with the resistance at 106.50, which it virtually did. The area of 107.80 was indicated as the next resistance, which the pair tried to reach on Thursday, but as the experts expected, the powers of bulls weakened, and the pair returned to the level of 106.00;


– USD/CHF – as it was expected, the pair kept bullish bias, however, so far it failed to get to the level of 1.0000. Having bounced off the support of 0.9800, the pair soared to the high of 0.9800, but afterwards it rebounded downwards again and wrapped up the week at the level of 0.9860.


***

Forecast for the Upcoming Week:

Summing up the opinions of several dozen analysts from world leading banks and broker companies as well as forecasts based on different methods of technical and graphical analysis, the following can be suggested:


– as to EUR/USD, 70% of experts, backed by 100% of indicators, tend to believe that during the upcoming week or two the pair will make attempts to reach the level of 1.0900. The remaining 30% of analysts and the graphical analysis on H1 represent an alternative viewpoint, they reckon that for a while the pair will continue moving in a sideways channel with the support of 0.9550 and the pivot point of 1.1000. The United States Federal Reserve Interest Rate Decision and the corresponding statements on Wednesday may change this trend;


– Brexit picture is so mixed, that the graphical analysis for GBP/USD on all main time frames doesn’t allow making any forecasts. As to the majority of experts (75%), in their view bearish sentiment continues at the market, and the pair, having finished the retracement, will strive to the support within 1.2850–1.2900, and 95% of indicators on Н4 and D1 agree with this scenario;


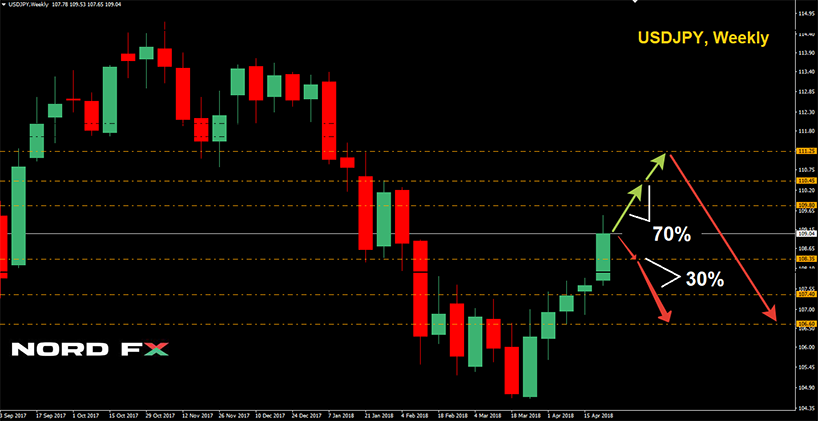
- opinions of the analysts and indicators as well as the graphical analysis about the future of USD/JPY can be narrowed down to the thing, that the pair will continue moving in a sideways channel, and afterwards, having bounced off the resistance in the area of 107.40–107.60, will go south and, having broken through the support of 105.50, will go down by further 200 points – to the support of 103.50. But here, Bank of Japan Interest Rate Decision, released in the early Friday morning, can make certain adjustments;


– as to the last pair of our review – USD/CHF, everything remains unchanged: the bullish bias of the pair attempting to reach the level of 1.0000, the pivot point at 0.9880, the first support will be at 0.9840, the second – at 0.9840, and if it will be broken through – fall to the level of 0.9700.


Roman Butko, NordFX


Notice: These materials should not be deemed as a recommendation for investment or guidance for working on financial markets and they are for informative purposes only. Trading on financial markets is risky and it can lead to loss of money deposited.
 

Julia NordFX

Broker Representative
Generalized Forex Forecast for 01 – 05 August 2016

First, a review of last week’s forecast:


– as to EUR/USD one alternative forecast suggested that the pair would move in a sideways channel with the support of 0.9550 and the pivot point of 1.1000. The United States Federal Reserve Interest Rate Decision and the corresponding statements, due to be released on Wednesday, were supposed to change this trend. And that was the case: the miracle didn’t happen, to the utter disappointment of investors, the interest rate was kept on hold at 0.5%, and thus the greenback fell against euro by around 200 points;


– GBP/USD. The powers of bulls and bears turned out to be almost equal, and for the second consecutive week the pair had been moving within the range of 1.3070–1.3290 with the pivot point of 1.3200. Bearish sentiment was expected to predominate at the market, but news from the USA weighed in on here, whereby the pair ticked up a little bit and transited from the lower boundary of the sideways channel to the upper one;


– the forecast for USD/JPY reckoned that the retracement was over, and, having broken the support of 105.50, the pair would go south to the next support in the area of 103.50. But a reservation, declaring that the Bank of Japan Interest Rate Decision could make certain adjustments, was also made here. And as it turned out to be higher as it was expected (–0.1% versus expected –0.2%), yen reinforced its positions against the US dollar even more, reaching the level of 102.00 by the end of the week;


– USD/CHF – as it was expected, till the mid-week the pair kept bullish bias and went up to the mark of 0.9950. And then, as often happens during coming out of headline news, mirrored the acting of EUR/USD, and, having broken through the support levels of 0.9840 and 0.9800, it went down, wrapping up the week at 0.9700 - the area of the third support, indicated by experts.


***

Forecast for the Upcoming Week:

Summing up the opinions of several dozen analysts from world leading banks and broker companies as well as forecasts based on different methods of technical and graphical analysis, the following can be suggested:


– as to EUR/USD, opinions of experts were split equally. 50% of them, backed by the graphical analysis on H1 as well as by 90% of indicators on H4 and on D1, tend to believe that the pair will continue rising and try to consolidate in the area of 1.1250–1.1300. As for the second half of experts, in their opinion the pair is currently keeping within the upper boundary of the range of 1.0955–1.1190, having bounced off which it should start going south. With this it should be taken into account that on August 5, 2016 NFP data – the key indicator of economic health of the USA - will be released, and they usually result in plummeting of exchange rate of buck. According to some forecasts NFP for this month can drop from 287k to 175k;


– Brexit picture is still mixed, that’s why 75% of experts, backed by the graphical analysis and indicators on D1, believe that GBP/USD will continue its horizontal movement within the range of 1.3050–1.3335 with the pivot point of 1.3200. And only 15% of analysts do not rule out the possibility that it will try to retest July lows in the area of 1.2800 again. NFP data as well as ECB meeting on Wednesday and a series of headline news from the Bank of England, due to be released on Thursday, August 04, can influence formation of a new trend;


– as to the future of USD/JPY, 30% of analysts in line with 100% of indicators reckon that the pair will try to go down to the level of 100.00. Almost 40% of experts and the graphical analysis on Н4 and D1 do not agree with this version. In their opinion the level of 101.50 will become a strong support to the pair, and backing on it, the pair will make attempts to reach the resistance of 103.60, and if it will be broken through – even get to 106.50. And, finally, the third scenario is offered by remaining 30% of analysts, voting for a sideways trend alongside the pivot point of 102.50;


– as to the last pair of our review – USD/CHF, here experts along with the graphical analysis on H4 predict that the pair will move in a sideways channel of 0.9660–0.9720 for a while, and afterwards it will go down to the support of 0.9500. Such a scenario will be more likely if the forecast for change in NFP will turn out to be correct.


Roman Butko, NordFX


Notice: These materials should not be deemed as a recommendation for investment or guidance for working on financial markets and they are for informative purposes only. Trading on financial markets is risky and it can lead to loss of money deposited.
 

Julia NordFX

Broker Representative
OLYMPIC DEMOCUP

Competition Dedicated to the Olympic Games in Rio de Janeiro

Participate virtually, Earn really!

OLYMPIC DEMOCUP is a unique competition on demo accounts with real prizes, with 3 sets of awards in team and individual scorings.

The total prize fund is $ 23100!

Hurry up to take part, the registration ends soon!

Learn more at the website http://olympic.nordfx.com/
 

Julia NordFX

Broker Representative
Generalized Forex Forecast for 08 – 12 August 2016

First, a review of last week’s forecast:


– as to EUR/USD, the pair met expectations of both those experts supporting its rise to the area of 1.1250 and those predicting that the pair would start going south. So earlier in the week the pair surged upwards, reaching the mark of 1.1235 on Tuesday, and afterwards it reversed and showed an equal plunge. Acting of the pair on Friday was somewhat surprising, when the USA data were announced. As a reminder, the forecast reckoned that NFP could drop from 287k to 175k. Actual value (255k) indeed came out lower than the previous one, but not enough to meet expectations of the market. Eventually instead of weakening, the greenback strengthened its positions, rebounding by over 100 points versus euro. However then the pair returned to the pivot point of the last six weeks – to the area of 1.1090;


– GBP/USD. Uncertain situation with Brexit seems to balance the powers of bulls and bears for long. That’s why 75% of experts, backed by the technical analysis, believed that the pair would continue its horizontal movement within the range of 1.3050–1.3335. This is exactly what happened – neither ECB meeting, held on Wednesday, nor news from the Bank of England, released on Thursday, nor NFP data, released on Friday, could drive it out of this channel. Eventually the pair ended the week virtually at the lower boundary of the predetermined range – at 1.3060;


– giving forecast for USD/JPY, experts failed to form any consensus - 30% of analysts reckoned that the pair would try to go down to the level of 100.00, 40% of experts believed that it won’t be able to break through the support of 101.50, and, finally, the rest 30% voted for its sideways movement. In fact, on the second try the pair could break through the level of 101.50, and having turned it into the resistance, it changed over to a sideways trend, where it had consolidated till the release of NFP, whereby it returned to the area it had started the week from - 102.00;


– USD/CHF – as it was expected, earlier in the week the pair was moving in a sideways channel within 0.9660–0.9720, and afterwards it went down. However, it failed to get to the support of 0.9500, when rebounded from the last week’s low it reversed and, being supported by the news from Europe and the USA, it moved upwards, wrapping up the week around the key level of the last two years - 0.9800.


***

Forecast for the Upcoming Week:

Summing up the opinions of several dozen analysts from world leading banks and broker companies as well as forecasts based on different methods of technical and graphical analysis, the following can be suggested:


– as to EUR/USD, most experts concur that the down trend, started on August 2, will continue, and the next target for the pair will be the support within 1.0950–1.1000. 85% of indicators on H4 and D1 as well as the graphical analysis on H1 and H4 agree to this scenario. With this, the graphical analysis specifies that early in the week the pair may tick up to the upper boundary of the down trend – up to 1.1130, having bounced off which it will go down to the support of 1.1035, and then even further down to 1.0950. If the resistance of 1.1130 is broken through, the pair can rise up to the next resistance of 1.1170, which is at the upper boundary of a three-month descending channel, which had begun on May 3. The third resistance will be at 1.1220;


– 70% of experts expect GBP/USD to rebound upwards from the lower boundary of the horizontal channel of 1.3050–1.3335, and according to them it will keep within this range for a few days. The remaining 30% of analysts, backed by the graphical analysis on D1, believe that the increased volatility of the pair will allow it to expand this range up to the levels of 1.2800 and 1.3500. In this case the upwards rebound should be expected already from this channel of 1.2800. Early next week we’ll see which of this scenarios will play out, however, it should be mentioned that all 100% of experts predict that during August the price will retest the bottom within 1.2700–1.2800 again for sure;


– as to the future of USD/JPY, the majority of experts share the same opinion that the down trend of the entire 2016 has not finished yet, and the pair should be expected to go down first to the support of 100.00, and then further down to 98.90. With this, according to the graphical analysis on Н4, it is possible that before plunging the pair will first try to reach the upper boundary of this long-term descending channel (clearly seen on D1), which is at the area of 103.50–104.00;


– as to the last pair of our review – USD/CHF, the half of experts believes that the pair will try to consolidate above the level of 0.9800. 95% of indicators on H4 and 80% on D1 agree with this. The rest 50% of analysts, backed by the graphical analysis on H4 reckon that the level of 0.9800 will become rather a pivot point, alongside which the pair will be moving within 0.9735–0.9900, than a support.


Roman Butko, NordFX


Notice: These materials should not be deemed as a recommendation for investment or guidance for working on financial markets and they are for informative purposes only. Trading on financial markets is risky and it can lead to loss of money deposited.
 

Julia NordFX

Broker Representative
July 2016: TOP 10 Trading Signals Viewed by Analyst of NordFX


The vast majority of the traders using MT4 terminals are certainly familiar with an opportunity of automatic trading by means of the 'Signals' service integrated into this platform. The main difficulty while subscribing is a selection of the most appropriate signals in terms of combination of risk and profitability.

Unfortunately, the analysis shows that many traders/investors pay attention only to the last of all parameters, neglecting possible risks, and it results in negative impact on their deposits.

In order to help traders avoid these mistakes, monthly, for more than two years, the leading specialist of NordFX broker company, John Gordon, analyzes the choice of subscribers, making recommendations on how to get the maximum profit in case at minimal risks.


As of the end of July TOP-10 most popular signals among subscribers is as follows:

I. MenjadiTrader PAMM 144842 (growth 86%, 784 subscribers),

II. Stable Forex Profit (growth 16293%, 257 subscribers),

III. Lemar Analytics ECN (growth 131%, 197 subscribers),

IV. Revolution(growth 3987%, 143 subscribers),

V. Arrow (growth 1853%, 112 subscribers),

VI. F Cracker (growth 201%, 102 subscribers),

VII. Lemar Investment Group (growth 942%, 101 subscribers),

VIII. Q2FX 1 (growth 2189%, 119 subscribers),

IX. LVIK Forex Commo (growth 29%, 125 subscribers),

X. Setka Real2 (growth 1043%, 69 subscribers).


"The July list of top signals”, begins the overview J. Gordon, "was updated, as compared to June Top, by only 30%, the key positions were taken by old players, on which I will focus today."


MenjadiTrader PAMM 144842 signal has been taking the Ist place for the third consecutive month. With this, I'd like to pay your attention, that it has been among Top 3 signals during the entire 2016: January – the second place, February, March, April – the third place, and during the last three months – it proved to be an absolute leader with 784 subscribers, which have entrusted management of around one million dollars to the author of this signal management. Even though, its profitability seems to be more, than modest. Where others show a growth of hundreds and thousands of percents, it showed a growth of only 27% in last seven months

So why is it so popular? I guess, there are three reasons:

- the first one – the life span of the signal, 123 weeks in the market without loss of a deposit is already a certain guarantee;

- the second reason is a very small drawdown. It didn't not exceed 19% during these two and a half years, and in 2016 the maximum drawdown didn't exceed 3%.

- and, finally, the third one - subscription to this signal is absolutely free, that is important for investors with small deposits.


The second place in the rating is taken by Stable Forex Profit signal, it considerably differs from the first one. Suffice to say, that over seven months of this year the deposit growth made 780%. The signal is 83 weeks old, and that is a significant life span. However, on July 8, when the USA unemployment data were released, his author let himself quite a risky trading, and therefore his depositing made 72%. The maximum drawdown on this signal makes 55%, which is rather dangerous for those investors who used large bonuses on the deposit from their brokers.”


“Let me speak aside", the leading analyst of NordFX continues. "Good thing about the 'Signals' service, developed by the MetaQuotes Software Corp., is that it provides investors the data of online monitoring on more than 50 parameters, which allows evaluating a given signal fully and properly. Furthermore, the users of this service can carry on a direct correspondence with developers of signals and rate them.

So, for example, you can read how the subscribers to the signal Stable Forex Profit express their displeasure to its author (which, by the way, promised to change ‘the way of trading to a more cautious, aiming to keep DD within 10-20%’) at the most critical moments of trade.

In my opinion, such an on-line chat with subscribers and their reaction are rather useful addition to the parameters of the technical analysis and give additional information for evaluation of signal quality. So, in respect of the number of signals, for instance, the subscribers complain about slippage, as a result of which their results, when copying, appear to be significantly lower, than the results of the author of the signal. It is very important information, worth paying attention to, especially in case of pips strategies.


And, finally, one more signal which ranks among the popularity TOP among subscribers for the fifth month in a row is Q2FX_1 – impressive profit of 2189% with an admissible maximum drawdown of 32%. A certain wariness here causes the fact that in June-July the drawdown chart showed a significant increase, which is, to my mind, connected with desire of the author of the signal to improve his indicators, which were doubled in comparison with April-May ones. And, as we know, the higher the profit, the higher the risks.”


"It'd be quite convenient,” John Gordon adds, "if developers of the 'Signals' service introduced one more chart into a monitoring complex – changes of the number of subscribers. In my opinion, it would really help insufficiently qualified investors understand whether it is worth being signed to a given signal or not.

For example, let us consider the above-mentioned MenjadiTrader PAMM 144842: January – 246 subscribers, February – 250, March – 225, April – 336, May – 447, June – 430, July – 784. In six months the number of subscribers tripled, suggesting that you should not expect unpleasant surprises from this signal.

Or another signal, which riskiness we discussed in the previous reviews a lot, – Green Line Signals: February – 140 subscribers and a growth of 510%, March – 296, April – 478, May – 125. We should admit that it is a quite disturbing signal! And, finally, June – the nullified deposit and zero subscribers."

"I repeatedly warned", the leading analyst of NordFX sums up the overview, "that you should be cautious while subscribing to signals which are only several months old. Therefore, selecting this or that signal, I urge to use MetaQuotes service which allows filtering them out not only by the profit size, but also by those parameters, which we paid much attention to today, – on the maximum drawdown and the number of subscribers."
 

Julia NordFX

Broker Representative
Generalized Forex Forecast for 15 – 19 August 2016

First, a review of last week’s forecast:


– the forecast for EUR/USD reckoned that early in the week the pair could tick up to the level of 1.1130, and if it was broken through – it would go up to 1.1170. The high of 1.1220 was indicated as the third resistance. The pair fully fulfilled the plan: on Tuesday it reached the level of 1.1130, on Wednesday it broke through it, got to the mark of 1.1170, having turned it into the pivot point, and on Friday it took the high of 1.1220 on news from the USA. After this uprise the pair rushed back, failing to drive out of the range of the three-month descending channel;


– as a reminder, speaking of GBP/USD, 100% of experts expressed the view, that during August the pair would retest the bottom within 1.2700–1.2800 again for sure. The pair seemed to hear that forecast, and during the whole week it was aggressively striving to go down, however, so far it could drop only to the mark of 1.2900;


– as to the last week’s acting of USD/JPY, it was impossible to form any consensus: experts pointed down – to the area of 98.90–100.00, the technical analysis reckoned that before going down the pair would first try to reach the upper boundary of this long-term descending channel within 103.50–104.00. Eventually, moving alongside the sideways channel, the pair failed to reach either mark, keeping within 100.96–102.65;


– USD/CHF – here the half of experts believed that the pair would try to consolidate above the level of 0.9800. The rest 50% of analysts reckoned that the pair would fail to do so, and that it would move within 0.9735–0.9900. Looking at the weekly chart, it may be concluded that both turned out to be right: during the first two days the pair tried hard to consolidate above the level of 0.9800, and afterwards the bulls gave up, and the pair plunged, wrapping up the week in the area of 0.9750.


***

Forecast for the Upcoming Week:

Summing up the opinions of several dozen analysts from world leading banks and broker companies as well as forecasts based on different methods of technical and graphical analysis, the following can be suggested:


– giving forecast for EUR/USD, most experts, backed by the graphical analysis on H4, indicate the area of 1.1100 as the nearest support. The area of 1.1230 is expected to act the resistance, and if it is broken through, the pair can make attempts to heave upwards by further 100 points – up to the level of 1.1330. 80% of indicators on Н4 and D1 agree with this scenario. As for the longer-term outlook, near 100% of experts are sure that the three-month descending trend will continue, and the pair will try to reach the level of 1.0800 or even 1.0600;


– it’s clear, that speaking of the future of GBP/USD, 100% of indicators point to the south. As to the experts and the graphical analysis, they believe that in the short term the pair will fail to rise above the support of 1.2810–1.2850, and when bouncing off it, the pair will go up to the area of 1.3200–1.3250. It should be specified that around 70% of experts are sure that in the medium term the pair will go south again under the bears’ pressure, where it will try to test the support of 1.2700, and if it is broken through, it will go further down – to the mark of 1.2500;


– as to the future of USD/JPY, the majority of experts and the graphical analysis on H4 and D1 agree that for a while the pair will continue moving in a sideways channel within 100.70–102.50, after which it will upswing to the area of 103.00-104.00. And only 20% of analysts believe that there is still a chance that the pair will go down to the mark of 100.00;


– as to the last pair of our review – USD/CHF, the forecasts have been indicating to the magic level of 0.9800 for several months in a row. And this week the experts believe that first the pair will strive for reaching this high, and then it will consolidate above it – at the area of 0.9800–0.9900. Agreeing with this scenario, the graphical analysis specifies that first the pair will make several attempts to rise above the resistance of 0.9765 and only then, rebounding from the support of 0.9700–0.9730, will surge northwards.


Roman Butko, NordFX


Notice: These materials should not be deemed as a recommendation for investment or guidance for working on financial markets and they are for informative purposes only. Trading on financial markets is risky and it can lead to loss of money deposited.
 

Julia NordFX

Broker Representative
Generalized Forex Forecast for 22 – 26 August 2016

First, a review of last week’s forecast:


– the forecast for EUR/USD reckoned that having rebounded from the support of 1.1100, the pair would go up – to the resistance of 1.1230, and if it was broken through, the pair could heave upwards by further 100 points – up to the level of 1.1330. Considering the backlash, common to the levels of support/resistance on D1, the forecast can be considered as panned out: having bounced off the level of 1.1153, as early as Tuesday the pair broke through the first resistance and consolidated above it. By Thursday it had approached the second resistance, by inertia it slipped past further 35 points, and then it returned to the area, specified by experts, wrapping up the week at the level of 1.1325;


– the forecast for GBP/USD can also be deemed as fulfilled, moreover – 100% fulfilled. As a reminder, the experts and the graphical analysis believed that in the short term the pair would fail to rise above the support of 1.2810–1.2850, and when bouncing off it, the pair would go up to the area of 1.3200–1.3250, which virtually happened: the last week’s low - 1.2865, high 1.3185;


– for a couple of weeks there were debates about whether USD/JPY could reach the area of 98.90–100.00 or not. First, most analysts agreed with this scenario, and then their number diminished progressively. And when there were only 20% of experts left, the pair hardly passed the support of 100.86, and went one level down, and, finally, reached the landmark level of 100.00, turning it later into the pivot point;


– USD/CHF – the graphical analysis turned out to be the closest to the truth, reckoning that before reaching the level of 0.9800 the pair would make several attempts to rise above the resistance of 0.9765, after which it would rebound to the support of 0.9700–0.9730. But even this forecast can be deemed as partially fulfilled. Indeed, on Monday within hours the pair tried to break through the area of 0.9765. Actually it failed and went down. But therewith the bears appeared to be so strong, that they could easily jump over the timid resistance of the opponent, and, instead of expected 50 points, the fall made around 200 points.


***

Forecast for the Upcoming Week:

Summing up the opinions of several dozen analysts from world leading banks and broker companies as well as forecasts based on different methods of technical and graphical analysis, the following can be suggested:


– giving forecast for EUR/USD, around 60% of experts, supported by the graphical analysis on Н4, believe that, backing on the support of 1.1300, the pair will try to reach the resistance of 1.1425, after which it will bounce downwards to the area of 1.1200–1.1230. Two options are indicated as alternative viewpoints: the first one is a sideways movement with the pivot point of 1.1300, and the second one – a descending trend from earlier in the week with the same target of 1.1200;


– according to both most experts and the graphical analysis as well as indicators on Н4 and D1, the main forecast for GBP/USD for the near future is continuation of a sideways trend, formed after Brexit. Currently the pair is keeping within the central line of this horizontal channel – at 1.3080, and according to the readings of the graphical analysis, its movement northwards, which started last week, will continue. With smooth consolidation, the nearest target for this pair is the resistance of 1.3280, and if it is broken through - 1.3350. The third resistance will be at 1.3500. Alternative viewpoint implies rebounding of the pair from the central line to the lower boundary of the specified channel - 1.2850;


– predicting the future of USD/JPY, the readings of many indicators differ: 65% on Н1 vote for Buy, 70% on Н4 - for Sell and 30% for Buy, and 100% on D1 vote for Sell. There is also no consensus among the experts – 50% vote for the pair’s rise, 30% - for its fall, and 20% - for its sideways movement alongside the line of 100.00. The level of 099.00 is indicated as the main support here. The only one, who offers more or less agreed forecast, is the graphical analysis on Н4 иD1 – both imply the pair’s rise to the resistance of 102.00. And only after these goals are met, it will be able to go 300 point lower – to the mark of 099.00;


– as to the last pair of our review – USD/CHF, 80% of analysts, backed by the graphical analysis on Н4, reckon that last week the pair reached its local bottom at 0.9535, after which for a while it will be moving in a sideways channel of 0.9535–0.9640 with the pivot point of 0.9590. Then the pair is expected to move in an uptrend, the first resistance will be at 0.9710, the next - at 0.9800. The target for autumn remains the same - 1.0000.


Roman Butko, NordFX


Notice: These materials should not be deemed as a recommendation for investment or guidance for working on financial markets and they are for informative purposes only. Trading on financial markets is risky and it can lead to loss of money deposited.
 

Julia NordFX

Broker Representative
Olympic DemoCup from NordFX – Games, Which Traders Make Money on


In parallel with the Olympic Games in Rio de Janeiro, Forex broker NordFX held its own "Olympic Games".


And so, the Olympic flame went out. For some this sport event became the way to the medal stand, for others – bitterness of defeat.

The rush of winning is in human nature, and this refers not only to wrestlers or track and field athletes, but also... to traders. Each of us wants to prove to the whole world, that he is faster, stronger, and more successful than the others. Sportsmen demonstrate it during the Olympic Games and the championships, as for the traders, DemoCup contest, which has been held for six years now by Forex broker NordFX, gives them such opportunity.


Only virtual demo accounts participate in this two-week contest, which takes place in the middle of each month. However, the prizes awarded to the winners are quite real – monthly prize drawing makes $3500, $3000 from which are divided among 10 winners, and 10 contestants obtain consolation prizes of $50.


In total, since March, 2010, about 300.000 dollars were awarded! Even though anyone can take part in this contest absolutely for free.


The thing, which juices up this contest, is that traders from almost 100 countries take part in it, namely, from: China and Russia, Ukraine and India, Kyrgyzstan and Sri Lanka, Romania, Iran, Thailand, Poland, Kazakhstan, Egypt, Belarus, Indonesia, Uzbekistan, Vietnam, Estonia, Korea, Singapore, Hong Kong, Australia, Bulgaria, France, Pakistan, Mexico, Lithuania, the Czech Republic, Moldova and the USA, Morocco and Syria, Israel and Nigeria, Bangladesh, Great Britain, Peru, the United Arab Emirates, Germany, Tajikistan, Costa Rica, Saudi Arabia, Malaysia, Paraguay, Brazil, Libya, Armenia, Angola, Chile, Spain, Colombia, Ghana, Slovakia, Uruguay, Cote d'Ivoire, Algeria, Yemen, Argentina, Latvia, Bolivia, Ecuador, Azerbaijan, Nepal, Philippines, Cuba, Kenya, the Republic of South Africa, Taiwan, Peru, Morocco, Venezuela, Tunisia, Guatemala, Italy, Georgia, El Salvador, the Dominican Republic, Portugal, Bahrain, Mongolia, Kuwait, Swaziland and even from Saint Helena...


"The geography of the contestants is so broad, that DemoCup can be easily called a world-wide contest", the leading analyst of NordFX and the jury member John Gordon says. "And so we thought why not to hold our own Olympics for the traders in parallel with the Olympic Games in Rio de Janeiro. So said - so done: we established the organizing committee, developed special rules and allocated a very plum prize fund of $23100 for the winners.


Unlike standard, regular DemoCup, in the Olympic DemoCup we drew three sets – total 89 – of awards in team and individual scorings. The contests were held from August 8 to August 19, and during all these ten days the heat of the struggle did not subside for even a minute, the traders looked for the slightest opportunity to increase individual and team deposits.

And if in the medal ranking at the Olympic Games in Rio the Russian team took only the 4th place, here it could step on the top of victory podium. In a very short time twenty best traders from the Russian team could increase their deposit by 22.5 times – from two hundred thousand to almost four and a half million virtual dollars! Such that they received yet 10000 real dollars – $500 for each member of the "gold" twenty.


The national team of Ukraine got "silver" and $5000, and the representatives of China, having overtaken Russian sportsmen in Rio, took only the third place in the Olympic DemoCup, having received $2500 as a prize. As for the host country of the Olympic Games – Brazil, it took the fourth place. One more South American country – Venezuela - was in Top 5.

As for individual scores, Russian trader, who increased the deposit from 10.000 to 1.670.000 dollars, that is by 167 times, became the absolute winner here! Having won in all three nominations, he obtained $2000 as an award.

The organizers didn't forget about consolation prizes of $50 each, which got representatives of Pakistan, Vietnam, Egypt, Cuba, Kyrgyzstan, Nigeria, Belarus, Indonesia, Mexico and India.


"I'd like to emphasize", J. Gordon says, "that contests on demo accounts require traders to have not less, and sometimes even more self-control. If, trading on the real account, the trader is constantly struggling with a fear to lose his deposit, he has to overcome euphoria from the first successes and the seeming impunity – because the money is not real. Of course, a loss won’t ruin him, but he won't become a winner either. In DemoCup it is very easy to cross that fine line between a justified risk and mindless adventurism."


"In conclusion", the jury member sums up, "I'd like to congratulate our winners and invite all traders to take part in the next stages DemoCup, which, as a reminder, unlike the Olympic Games, are held every month. The annual prize fund makes $42000, and you can study the rules of the contest on NordFX website, they are simple. I'm sure, that you will appreciate advantageous terms and high quality of the services, which NordFX offers to each client. And the number of our clients, – John Gordon smiles, – already makes about 1.500.000 – a big close-knit family Olympic family!”
 

Julia NordFX

Broker Representative
Generalized Forex Forecast for 29 August – 02 September 2016

First, a review of last week’s forecast, which for all four pairs may be considered if not 100%, but at least 90% fulfilled:


– all three variants of the forecast for EUR/USD, suggested by the experts last week, considered the level of 1.1200 as the ultimate target, which was actually reached on Friday evening, “supported” by the U.S. Federal Reserve Chair Janet Yellen, having brought hope to investors for the rate hike by the Fed before the end of 2016;


– the forecast for GBP/USD can also be deemed as 100% fulfilled. As a reminder, both the experts and the technical analysis predicted the continuation of a sideways trend, formed after Brexit. Considering smooth consolidation, the resistance of 1.3280 was indicated as the nearest target, which the pair reached last Wednesday, following which it rebounded to the center of the channel, wrapping up the week at the level of 1.3130;


– predicting the future of USD/JPY, there was no consensus between the experts and the indicators. The only one, who offered more or less agreed forecast, was the graphical analysis on Н4 and D1, insisting on the pair’s rise to the resistance of 102.00, which virtually happened on Friday, when the pair reached the high of 101.94;


– as a reminder, the forecast for USD/CHF reckoned that for a while it would be moving in a sideways channel of 0.9535–0.9640 with the pivot point of 0.9590, then the pair was expected to move in an uptrend with the first target of 0.9710, and the next - 0.9800. Except that the pivot level became the lower boundary of the channel, that forecast turned out to be absolutely correct. During the first half of the week the pair had been moving strictly to the east, after which it went to the north, and by the end of the week it virtually reached the ultimate target, having risen up to the level of 0.9792.

***

Forecast for the Upcoming Week:

Summing up the opinions of several dozen analysts from world leading banks and broker companies as well as forecasts based on different methods of technical and graphical analysis, the following can be suggested:


– EUR/USD. After the speech of J. Yellen a “certain uncertainty” crossed the minds of both analysts and indicators’ readings. In other words, one half of experts reckons that the pair will return to the resistance of 1.1365, the other half believes that, for sure, it will try to retest the bottom in the area of 1.1200 again. As for the indicators, the ones on Н4 point to the south, and the ones on D1 predict a sideways trend. It appears that in such a situation the economic data from Europe, which are due to be released on Wednesday, and, especially, NFP data - the key indicator of economic health of the USA, which will be released on Friday, September 2, will have the major impact on the pair’s movement. The forecast for NFP reminds of the month old unfulfilled forecast, and it predicts that this figure will fall from 255Кto 164К–188К;


– trying to give a forecast for GBP/USD we can see a variety of opinions similar to EUR/USD. However, the whole diversity of views and readings can be reduced to a certain common denominator, according to which the summer sideways trend should be expected. The level of 1.3000 is indicated as the main support, and the level of 1.3320 – as the main resistance. The next resistance will be at 1.3385. With this, the graphical analysis on both Н4 and D1 warns that fist the pair can go down to the support area, and only then, having rebounded from it, it will surge upwards. The ultimate target here will be the third resistance at 1.3560. As to the forecast for autumn in general, 80% of experts have sided with the bears and they predict a possible decline of the pair to the area of 1.2500–1.2800;


– giving forecast for USD/JPY, we can speak of a consolidation of this pair around the pivot level of 100.80. The resistance will be in the area of 102.20, the support - 099.90. With this, the graphical analysis on D1 points out that the pair will seek the area of 0.9840–0.9880, but it can spend from one week to two weeks to break through the support of 099.90. As for the forecast for the upcoming months, only around 70% of experts, backed by the graphical analysis, reckon that the pair will go up to the area of 105.00–107.00;


– as to the last pair of our review – USD/CHF, 100% of analysts, supported by the graphical analysis on H4, expect the pair to move alongside the pivot point of 0.9680 with predominance of bearish trends. The resistance will be at 0.9800, the support – at 0.9640.


Roman Butko, NordFX


Notice: These materials should not be deemed as a recommendation for investment or guidance for working on financial markets and they are for informative purposes only. Trading on financial markets is risky and it can lead to loss of money deposited.
 

Julia NordFX

Broker Representative
Forex Forecast for USD, GBP, JPY and CHF for 05 – 09 September 2016

First, a review of last week’s forecast:


– as for the forecast for EUR/USD, those 50% of experts, which reckoned that, for sure, the pair would try to retest the bottom in the area of 1.1200, turned out to be right. The indicators on H4, which pointed to the south (where the pair did move early week), as well as the ones on D1, which predicted a sideways trend (on Thursday the pair returned to the figures of Monday), turned out to be right. Diverse data on the USA economy at the end of the week put in pie, and thus the pair started to jig up and down, and eventually it wrapped up the week at the level of 1.1150 – at that very area, where as far back as last June the long-term sideways trend, keeping EUR/USD within the range of 1.0500 – 1.1500, had started;


– with a small tolerance, the forecast for GBP/USD may be deemed as 100% fulfilled. As anticipated, first the pair went down – to the support of 1.3000, but when 50 points were left to reach it, the pair reversed and by the end of Friday it hit the resistance of 1.3320, specified by the experts, approaching the upper boundary of the sideways trend, alongside which it had been moving during the last two months;


– giving the forecast for USD/JPY for the week, the analysts indicated the level of 102.20 as the main resistance. As for the pair’s rise to the area of 105.00–107.00, the pair was supposed to spend at least one to two months to do so. However, it seemingly intends to do so much faster. At least, in the past week alone it surged up by 250 points and, having broken through the resistance of 102.20, it reached the high of 104.30;


– the assumption that USD/CHF tended to continue the sideways movement turned out to be correct – it finished the week at the same area, it had started from. As a reminder, during the past few months the analysts reckoned that it would strive to consolidate above the level of 0.9800. The pair made that very attempt once again also last week. However “the shoot to the north” failed to be convincing, and having got over just 85 points, the pair went back to the landmark level of 0.9800.


***

Forecast for the Upcoming Week:

Summing up the opinions of several dozen analysts from world leading banks and broker companies as well as forecasts based on different methods of technical and graphical analysis, the following can be suggested:


– EUR/USD. The opinions of the analysts still differ – 40% of them believe that the pair will go up – to the resistance of 1.1300. The remaining 60%, backed by the indicators and the graphical analysis on Н4, predict the pair’s fall first to the support of 1.1125 and then down to 1.1070. Afterwards, in their view, for a while the pair will be moving in a horizontal channel of 1.1000 – 1.1160 with the pivot level of 1.1070;


– clearly, assessing the prospects for GBP/USD, most indicators (75%) point to the north. As for the analysts, we may outline two scenarios. According to the first view (held by 80% of experts and the graphical analysis on D1), the pair will try to break through the resistance of 1.3370, and, once this happens, try to reach the highs of July 15 and June 29 - 1.3480 and 1.3530, respectively. As for the remaining 20% of analysts and the graphical analysis on H4, they believe that first the pair should plunge to the pivot level of summer sideways channel in the area of 1.3065. We’ll see which of these scenarios will play out early in the week. With this, note that data on the EU economy, and in particular, the ECB interest and deposit rates decision, may influence the change of the trend. However the mega-regulator is expected to keep them on hold;


– giving the forecast for USD/JPY, both the experts and the graphical analysis believe that the pair will be able to get over the resistance within 104.00 – 104.50, and it will have to move down to the support of 102.30. With this, the graphical analysis on D1 reckons that during the month the pair can go further down – to the level of 100.90;


– as to the last pair of our review – USD/CHF, the forecast here has been without any major changes for weeks – a gradual consolidation at the pivot level of 0.9800, which can be clearly seen on D1 and W1 charts. The nearest support will be at the levels of 0.9760 and 0.9735. The resistance will be at 0.9840, 0.9885, 0.9955. With this, if indicators on H4 take a neutral position, then the ones on D1 point up, reflecting the prevalence of bullish trends. The upcoming most significant events worth noting are release of GDP data from Switzerland on Tuesday and data on unemployment rate – on Friday.


Roman Butko, NordFX


Notice: These materials should not be deemed as a recommendation for investment or guidance for working on financial markets and they are for informative purposes only. Trading on financial markets is risky and it can lead to loss of money deposited.
 

Julia NordFX

Broker Representative
Forex Forecast for USD, GBP, JPY and CHF for 12 – 16 September 2016

First, a review of last week’s forecast:


– as for the forecast for EUR/USD, those 40% of experts, who believed that the pair would go up to the resistance of 1.1300, which virtually happened, were right. As expected, the ECB interest and deposit rates decision and corresponding commentary from the governor of the mega-regulator turned out to be the key event for it. Eventually, having reached the level of 1.1325 on Thursday, the pair showed impressive volatility, then it reversed and went down, wrapping up the week around the strong level of support/resistance of 1.1230;


– as a reminder, assessing the prospects for GBP/USD last week, 80% of experts, the graphical analysis on D1 and 75% of indicators pointed to the north, indicating 1.3370 and 1.3480 as the levels of resistance. As expected, as early as Monday the pair reached the first target, rebounded, but in a day it overcame this obstacle and surged further upwards. It failed to reach the high of July 15 - 1.3480 – however even the high of 1.3445 may be considered as the upper boundary of the summer sideways channel. Having reached it, the pair reversed and returned to the levels of the early week;


– the forecast for USD/JPY reckoned that the pair would fail to get over the resistance in the area of 104.00 – 104.50, and it would have to move down to the support of 102.30. With this, the graphical analysis specified that during the month the pair could go further down – to the level of 100.90. However, data on the USA economy allowed making a breakthrough to the south much earlier – as early as Tuesday, on September 6, the pair literally collapsed, having reached the bottom at the level of 101.20. However later the bulls could pare over half of losses, and by Friday the pair returned to the area of 102.50 – 103.00;


– if usually USD/CHF shows strong negative correlation with EUR/USD, last week, on top of that, it almost precisely replicated the chart of USD/JPY, simultaneously confirming the forecast for a gradual consolidation at the pivot level of 0.9800. During the whole year the pair has been haunting this level, which happened also this time – it ended the week in the area of 0.9750 – 0.9785.


***

Forecast for the Upcoming Week:

Summing up the opinions of several dozen analysts from world leading banks and broker companies as well as forecasts based on different methods of technical and graphical analysis, the following can be suggested:


– predicting the future of EUR/USD, the vast majority of experts believe that the ascending channel, which had begun in July, will continue. According to this forecast, for a while the pair can move backing on the support of 1.1200, following which it will go up. The nearest target will be at 1.1420, if it will be broken through - 1.1500. Only one analyst expressed an alternative point of view – in his opinion, in the near future the pair will break through the boundary of the ascending channel and it will go down to the support of 1.1120;


– assessing the prospects for GBP/USD, most indicators tend towards a sideways movement. The experts, backed by the graphical analysis, determine the boundaries of this channel ranging from 1.3200 to 1.3500. With this, lots of news from Great Britain, released on Tuesday, Wednesday and, especially, on Thursday, can influence the acting of the pair. As for the longer term forecast, 75% of analysts along with the graphical analysis on D1 believe that, for sure, the pair will test the lows of June-July in the area of 1.2750 – 1.2850;


– giving a forecast for USD/JPY, both experts (65%) and the graphical analysis on Н4 and D1 expect the pair to fall down to the support of 101.20, and then even further down to 99.50. 10% predict a sideways trend, and the remaining 25% insist on the pair’s rise to the area of 103.20 – 104.00;


– as to the last pair of our review – USD/CHF, the forecast here remains unchanged - a gradual consolidation at the pivot level of 0.9750 – 0.9800. The support will be at the levels of 0.9685 and 0.9580. The resistance will be at 0.9840 and 0.9890.


Roman Butko, NordFX


Notice: These materials should not be deemed as a recommendation for investment or guidance for working on financial markets and they are for informative purposes only. Trading on financial markets is risky and it can lead to loss of money deposited.
 

Julia NordFX

Broker Representative
Forex Forecast for EURUSD, GBPUSD, USDJPY and USDCHF for 19 – 23 September 2016

First, a review of last week’s forecast:


– giving the forecast for EUR/USD, the vast majority of experts believed that for a while the pair would be moving sideways backing on the support of 1.1200, which was happening during the whole week, up until the middle of Friday. But then, instead of going up, the pair made a breakthrough to the south. Only one analyst predicted such a possible decline, in his opinion, the pair would break through the boundary of the ascending channel and go down to the support of 1.1120, which, however, it failed to reach, having stalled at the level of 1.1150;


– as expected, last week’s acting of GBP/USD was determined by lots of news from Great Britain. With this, 75% of analysts together with the graphical analysis on D1 predicted the pair’s strong bearish trend striving to keep within the boundaries of summer sideways channel. Which virtually happened, as a result of such a sharp drop, the pair even broke through the central line of this channel and reached the level of 1.3000;


– predicting the future of USD/JPY, experts split into three camps. Eventually the pair managed to support the opinions of the first, second and third camp. 65% of analysts together with the graphical analysis expected the pair to go down to the support of 101.20, on Tuesday it fell to the level of 101.40. 25% of experts reckoned that the pair would rise to the area of 103.20-104.00, on Thursday it obediently rose to the level of 103.35. And, finally, the remaining 10% of experts expected the pair to move in a sideways trend, eventually, the pair wrapped up the week almost at the same level it had started from – in the area of 102.25-102.60;


– USD/CHF pair sprang no surprises. As the experts expected, it failed to move away from the pivot point of 0.9800, having ended the week just at that very level.


***

Forecast for the Upcoming Week:

Summing up the opinions of several dozen analysts from world leading banks and broker companies as well as forecasts based on different methods of technical and graphical analysis, the following can be suggested:


– reasoning about the future of EUR/USD, 35% of experts and 15% of indicators on D1 reckon that the breakout can be false, and the ascending channel, which had started in July, will continue. However the majority of analysts do not agree with such a scenario, they expect the pair to fall further, first – to the level of 1.1100, and then –100 points further down. As for the medium-term forecast, the number of supporters of the pair’s decline makes up to 70%, and the area of 1.0500 – 1.0800 is indicated as the target;


– assessing the prospects for GBP/USD, most indicators (95%) and the technical analysis on D1 insist that the pair will continue falling to the lower boundary of the three-month sideways trend – to 1.2850. As for the experts, their opinions split almost equally into three camps – 35% vote for the fall, 30% - for the rise and 35% - for the sideways trend. The only thing they have in common is that the pair will still be keeping within the range of 1.2850 – 1.3450;


– there is also no consensus among the experts in respect of the forecast for USD/JPY. It is safe to say that Wednesday will be the core driver for the week trend, when the Interest Rate Decisions of the Bank of Japan and the US Fed and corresponding statements on the monetary policy of these countries will be released. As for the graphical analysis, the one on H4 predicts that for a while the pair will be keeping within 101.70 – 103.25. Following which, according to the readings of indicators on D1, the pair will plunge to the support of 100.50, having rebounded from which it will then surge upwards – to the resistance of 104.30, and if it is broken through, then even further – up to the high of 111.45;


– the forecast for the last pair of our review - USD/CHF – is still the same – movement alongside the pivot level of 0.9750 – 0.9800. The support will be at the levels of 0.9685 and 0.9640, the resistance will be at 0.9885. With this, giving a medium-term forecast, around 60% of experts predict bullish trends and striving of the pair to reach the high of 1.0100.


Roman Butko, NordFX


Notice: These materials should not be deemed as a recommendation for investment or guidance for working on financial markets and they are for informative purposes only. Trading on financial markets is risky and it can lead to loss of money deposited.
 

Julia NordFX

Broker Representative
Forex Forecast for EURUSD, GBPUSD, USDJPY and USDCHF for 26 – 30 September 2016

First, a review of last week’s forecast:


– the most intriguing for EUR/USD last week was whether the ascending channel, which had started in July, would continue. However, the acting of the pair didn’t give a clear answer to that question. Indeed, after the breakout, as expected, the pair went down to the support in the area of 1.1100–1.1120. But then, having rebounded from it the pair returned to the lower boundary of the uptrend and, having turned it into the resistance, continued its moving upwards;


– as a reminder, assessing possible acting of GBP/USD, experts split into three almost equal groups: 35% voted for the pair’s fall, 30% - for its rise, and 35% for the sideways trend. Eventually, the last camp turned out to be right – using the central line of summer sideways channel of 1.3060 as the resistance, the pair had been moving eastward during the whole week. With this, the bears didn’t cease to test the level of 1.2950, but the bulls could fight off all those attacks, and eventually the pair wrapped up the week at the level of 1.2960;


– as for USD/JPY, the Interest Rate Decisions of the central bank of Japan and the US Fed (which, as expected, were kept on hold) were no so much determining as the commentary on the monetary policy of those countries. Eventually, having kept within the sideways range during the first two days, on Wednesday the pair surged up – to the resistance of 102.80, and then, as the graphical analysis expected, it plunged. Having broken through the support of 100.50, by inertia the pair went further 40 points down – to the level of 100.10, and afterwards, when it calmed down a little, it returned to the specified area – to the area of 100.50–101.25;


– Wednesday was also determining for USD/CHF. And if until now the pair had been moving without moving apart from the pivot point of 0.9800, then, mirroring the acting of EUR/USD, it plunged. The technical analysis indicated two levels of support – 0.9685 and 0.9640, however, the pair preferred the average value and chose the level of 0.9660 as the week low, and afterwards, having bounced off it, it returned to the area of 0.9685–0.9740.


***

Forecast for the Upcoming Week:

Summing up the opinions of several dozen analysts from world leading banks and broker companies as well as forecasts based on different methods of technical and graphical analysis, the following can be suggested:


– EUR/USD. 95% of indicators on H4 and 80% on D1 point to the north. As for the analysts, 60% of them vote for the pair’s rise, and 40% - for its fall. This time the number of supporters of the sideways movement of the pair was zero. If the camp, voting for rise, wins, then the pair will return to the range of the ascending medium-term channel and consolidate above its lower boundary, alongside which it has been currently moving. In this scenario the minimum goal is to get to the area of 1.1260–1.1280, the target for the next weeks - 1.1410. As for the supporters of its fall, they indicate the level of 1.1120 as the target, the next support will be at 1.1045. It should be noted here, that unlike the week forecast, in medium term around 75% of experts give priority to the bears;


– the forecast for GBP/USD remains virtually unchanged. The most analysts, fully backed by the graphical analysis on H4 and D1, insist that the pair will continue to go down to the lower boundary of the three-month sideways trend – to 1.2850, and afterwards a reverse of the trend and return of the pair to the resistance of 1.3060 should follow.


– as for USD/JPY, the majority of analysts – 70%, backed by the indicators and the graphical analysis on D1, insist that the pair will continue its downtrend. With this, it should be noted, that currently the pair is at the level of very strong support – 101.00, and significant efforts might be required to get over it. If successful, the target of the pair will be the area of 99.00-100.00. According to the graphical analysis, during the month the pair might go further down – to the support of 96.50, afterwards it will return to the level of 101.00;


– talking about the near future of USD/CHF, 60% of experts and indicators on H4 and D1 believe that the pair should once again test the low of 0.9660, and possibly reach the bottom in the area of 0.9600. However, then the pair will nevertheless return to the pivot point of 0.9800, and more than 70% of analysts are sure about that.


Roman Butko, NordFX


Notice: These materials should not be deemed as a recommendation for investment or guidance for working on financial markets and they are for informative purposes only. Trading on financial markets is risky and it can lead to loss of money deposited.
 

Julia NordFX

Broker Representative
Forex Forecast for EURUSD, GBPUSD, USDJPY and USDCHF for 03 – 07 October 2016

First, a review of last week’s forecast:


– as a reminder, forecasting the future of EUR/USD, 60% of analysts voted for the pair’s rise up to the resistance of 1.1260–1.1280, and on Monday the pair actually reached the level of 1.1279. 40% of experts supported its fall, and on Friday the pair tested the bottom in the area of 1.1150. This time the number of supporters of the sideways trend was equal to 0. But if at least one expert had pointed to the east, his very forecast would have turned out to be the most accurate, as the pair ended the week almost where it had started from – at the level of 1.1240;


– currently GBP/USD is keeping within the lower area of the three-month sideways channel, and most analysts expected the pair to continue its declining to August lows in the area of 1.2850. However, the pair preferred to follow the suit of EUR/USD, and, using the central line of 1.3060 channel as the resistance, it transited to the sideways trend. Eventually the week session was ended, one might say, with a zero result – in five days the pair rose less than by 10 points;


– the same pattern may be observed as for USD/JPY. Here the majority of experts – 70%, backed by the indicators and the graphical analysis, insisted on continuation of the descending trend. With this, it was noted that significant efforts might be required to get over the strong support of 101.00. The area of 99.00-100.00 was indicated as the nearest target. Eventually the pair could approach the level of 100.00 for a short time, following which it strongly surged upward and finished the week at the level of 101.33;


– giving the forecast for USD/CHF, the experts together with the indicators reckoned that it should retest the low at the level of 0.9660, following which it should return to the pivot point of 0.9800. That forecast panned out 100%. In a week the pair made whooping four attempts to break through the specified support, and two of them made headway. And thus, on Thursday the pair freshened its September low, having fallen to the level of 0.9640, and then, as expected, it went back upward, having moved up to the level of 0.9755 on Friday. As for the end of the working week, the pair wrapped up the week the same as the other three pairs of our review, the final area virtually coincided with the starting area, and the pair came into a weekend at the level of 0.9712.


***

Forecast for the Upcoming Week:

Summing up the opinions of several dozen analysts from world leading banks and broker companies as well as forecasts based on different methods of technical and graphical analysis, the following can be suggested:


– EUR/USD. The great majority of indicators on H4 and D1 (90%) point to the north. With this, the vast majority of experts (80%) point to the south. Such dissent is possibly connected with the fact that the indicators cannot be aware of Friday (October 7) release of data on employment change from the USA. Forecasts for these data, including NFP, are positive for US dollar. And if NFP, as expected, increases from 151К to 170К–176К, EUR/USD pair can go down to the support of 1.1150. The next support will be at 1.1120. As for a longer term forecast, here 70% of analysts expect the pair to go down below the level of 1.1000;


– certainly, expectations for employment growth in the USA and negative forecasts in respect of industrial output in Great Britain (these data are also released on Friday) cannot but affect GBP/USD quotations. So, 65% of experts, backed by the absolute majority of indicators and the graphical analysis on H4, expect the pair to decline to August lows in the area of 1.2850. As for the graphical analysis on D1, it indicates the possibility of its greater decline – down to the low of July 06 at the level of 1.2795, following which the pair will return to the medium-term pivot point of 1.3060;


– as for USD/JPY, plenty of evidence suggests that the pair will transit to the sideways trend. So, the opinions of both experts and indicators on H4 and D1 split almost equally – about half of them vote for the pair’s rise, and the same number – for its fall. As for the graphical analysis, the one on H4 also tends to the sideways trend within 100.80–101.80. The graphical analysis on D1 extends the range of the pair’s fluctuations to 99.00–104.00, with this, it expressly points to predominance of bullish sentiment for this upcoming week;


– as before, nobody expects any surprises from USD/CHF. The pair continues a medium-term consolidation in the area of 0.9700–0.9800, diminishing volatility during the whole year of 2016. The main resistance will be at 0.9810, support – in the area of 0.9640–0.9660. With this, over 75% of experts believe that in the medium term the bulls will convincingly win, and the pair will make an upward breakout, observing the beginning of new year of 2017, at the high of 1.0100.


Roman Butko, NordFX


Notice: These materials should not be deemed as a recommendation for investment or guidance for working on financial markets and they are for informative purposes only. Trading on financial markets is risky and it can lead to loss of money deposited.
 

Julia NordFX

Broker Representative
September 2016: Pitfalls of Trading Signals Viewed by Analyst of NordFX


It is always interesting to watch how people make their choice and then understand why it happened. What is meant here is not future USA presidential elections, but the choice of the investors, subscribing to trading signals in the same-name service in MT4 platform. After all, people are not just subscribing, they virtually trust their, often considerable, funds to a given trader - provider of the signals.

It is well-known that anything money-related requires special attention. Naturally, this also applies to automatic copying of trades of other traders. Technically, it is possible just to choose the provider of the signals showing the maximum profit and copy his trading. But is it always the best option? As usual, the leading analyst of NordFX broker company John Gordon expresses his opinion on the subject. And, as often happens, he is not inclined to look at the choice of the subscribers only through rose-coloured glasses.


Following the results of September 2016, Top 10 of the most popular signals among the subscribers is as follows:


I. CALM (growth 2045%, 498 subscribers),

II. MenjadiTrader PAMM 144842 (growth 91%, 468 subscribers),

III. Seven Majors Renko Scalper (growth 301%, 336 subscribers),

IV. Revolution (growth 4138%, 317 subscribers),

V. New Stable Forex Profit (growth 44%, 261 subscribers),

VI. Small to BIG Money (growth 468%, 143 subscribers),

VII. WaterFragance (growth 1544%, 122 subscribers),

VIII. F Cracker (growth 281%, 98 subscribers),

IX. WaterFragance2 (growth 38%, 91 subscribers),

X. SURVIVOR (growth 2060%, 84 subscribers).


“If you don't mind”, J. Gordon peers at the monitor of his computer, “I will begin the analysis with the signal called CALM – the newbie of our TOP rating, which entered the TOP 10 for the first time. I tell you straight away that it took the first place not only among the subscribers, but also in the rating created by MetaQuotes company. And this is by no means unimportant, as two of these ratings very often don't match among themselves.


So, why do more than fifteen hundred investors have such a deep fascination for that signal, so that they entrusted to it $2.200.000 for management?

I guess, I'll be right in assuming, that its author has solid history as PAMM-manager. This is evident from his another signal – HOZYIN, which is accompanied by numerous deposits and withdrawal of funds.

As for CALM, this signal is a little more than one year old, and during the first 12 months it showed the growth of about 25% per month. With this, the drawdown repeatedly appeared in the area of 40% from the deposit, after which the author of the signal decided to lower the risks at least to 30%. But, as often happens, together with the risk the profitability also fell. According to the forecasts of the author, it will make from 10% to 15% per month now, and it's possible that with such parameters the signal will leave TOP 10 investors' preferences. But so far it makes an impression of a quite stable and profitable signal.”


“Here I want to pay attention to one specific moment connected with online monitoring on the website MQL5.com," J. Gordon continues. “Among the main and most marked parameters ‘The maximum drawdown’ is specified here. This parameter, on the one hand, is rather terrifying for the investors, but on the other hand – it is not reasonably objective. The paradox is that eventually it can only increase, but not decrease in any way.

Let's try to look into the matter of this nuance by the example of the same CALM signal.

When it started in life its author applied a rather risky strategy, and the maximum drawdown on equity at that time made 44%. If he began to risk even more, and the drawdown would increase, let's say, up to 60%, then it would be fixed in the corresponding column. However, our author reduced the risks, and value of his maximum drawdown fell to 30%. So what? He can trade another five, ten, twenty years, reducing the drawdown from 44% to 30%, 10%, to zero! But in this column from here to eternity those 44%, which were formed at the time of ‘wild youth’ of this signal, will be specified.

Does that sound fair?

In my opinion, such lifelong 'black spot' (do you remember the novel “Treasure island” by Stevenson?) isn't not quite fair. And the only option to get rid of this 'curse' is to register a new signal. But then the whole months-long or long-term work of the provider will be ruined, and this new signal will be at the very bottom of the rating, which no potential subscriber and investor will ever get to.

In my opinion, at least one more parameter – the average value of the drawdown for the whole life span of the signal - could be set forth near the maximum drawdown. Until this happens, I urge you to look attentively at the chart of the drawdown, which is included in monitoring of each signal. And before subscribing, compare dynamics of this chart to the data on profitability of the signal. This will give a true and fair view.


Data on profitability is generally very important and evident parameter which allows picturing what to expect from a subscription. Let's take, for example, Revolution signal – the IV place in this rating. The growth in a year and a half makes more than 4000% with the maximum drawdown of 8% – one would wonder what more could it be asked for? But if we look at the results of last months, it turns out that everything is not in the way that it wished to be. Indeed, last May 2015, the profit made 150%, and currently, in recent months, the picture has been absolutely different: April – 1.66%, May – 0, June – 1.53%, July – 6.79%, August – 3.31%, September (at the time of this article writing) – 0.62% at all! What thousands of percents are there to talk about? The annual forecast of MQL5.com – is just over 16% per year. It is up to you, dear readers, to decide whether it is worth subscribing to such signal.”


“And one more piece of advice", J. Gordon continues, “choose for subscription only those signals which can be analyzable on rather long time period – at least about a year. Otherwise, in a number of cases, you can discover unpleasant surprises. I don't want to suspect anybody of anything, but sometimes the results on the growth chart before the thin vertical gray line and after it differ significantly.

To clarify, this line means the beginning of online monitoring on the part of MQL5.com.

So, for example, in August one more signal, which in a month with the drawdown of less than 35% gained over 2800% of profit, approached TOP 10. Like I said: more than 2800% in 31 days! It's incredible! But it had been prior to the beginning of the independent online monitoring. And afterward – in September – it showed 37% of profit and drawdown of almost 60%. (That very drawdown which with a bonus of 100% most often leads to closing of accounts). I don't know how the author of this signal can explain such a decline in profit by 75 times. But I know that in September he instantly registered two new signals which showed the growth of... 6000% and 7000%, respectively, in less than a month!”


“I will watch this fantastic trader closely and I will surely tell you about his progress (or failures). Meanwhile I want to emphasize”, the leading analyst of NordFX sums up, “that we aren't going either to frighten investors, or, on the contrary, persuade them to subscribe to any given signal. We only want to share our experience of analysis of signals, to show what hides behind the figures and charts of monitoring, and to ensure that you received if not stratospheric, but though real profit. Admit that a bird in the hand is worth two in the wood. It is, by the way, one of the fundamental principles of work of our company – stability and reliability. Forex is serious business, which you should take extremely seriously. And, certainly, respectfully!”


#forex #forex_forecast #eurusd #forex_signals #binary_options

http://nordfx.com/
 

Julia NordFX

Broker Representative
Forex Forecast for EURUSD, GBPUSD, USDJPY and USDCHF for 10 – 14 October 2016

First, a review of last week’s forecast:


– as a reminder, predicting the future of EUR/USD most experts pointed to the south. NFP print (US Non-Farm Payrolls) was expected to increase from 151К to 170К–176К. On the back of this forecast during the whole second half of the week the bears had been steadily pushing the pair down, to the support of 1.1120, specified by the experts. However, the Bureau of Labor Statistics of the USA threw a curve: first, it adjusted its data for August - 151К instead of 167К, and then it announced that the print for September made 156К. Eventually, instead of expected rise we saw a drop, and ultimately EUR/USD pair returned to the last months’ pivot point – to the level of 1.1200, very quickly;


– last week we predicted decline of GBP/USD pair to the level of 1.2850, or even a greater decline to the low of July 06 to the level of 1.2795. But no one expected the thing happened on Friday – during Asian session trading the British currency plunged to the low seen in March 1985. Having started with the level of 1.2615, in just 3(!) minutes it fell down to 1.1840 at average. (It stopped declining at the level of 1.1940 with one brokers, and at the level of 1.1490, i.e. 450 points lower – with the others). As of this writing the analysts failed to achieve a consensus in respect of the reasons of such a collapse. For example, Bloomberg provided as many as six versions, and The Wall Street Journal reduced them to two versions, indicating robo traders and the president of France, François Hollande, who stated that Great Britain would be seriously affected by Brexit, as the main “suspects”. Afterwards the pound broke through the technical levels of support, which sharply increased currency sell-off by robo traders. The result of what mess these soulless computer programs can cause is, as they say, obvious. However, later with the assistance of people the pound went up again, but it was not easy to regain the losses of almost 1000 points quickly, and GBP/USD wrapped up the week at the level of 1.2430;


– as for USD/JPY, here the graphical analysis on D1 gave the most accurate forecast. As a reminder, it expressly indicated predominance of bullish sentiment and rise of the pair to the level of 104.00. That exactly what happened – gradually moving up, on Thursday the pair reached the high of 104.15, following which the bears regained 125 points and the pair froze at the support area of 102.90;


– USD/CHF. As expected, the pair continued consolidating at the area of 0.9700–0.9800. Supporting bullish sentiment, last Friday it tried to break through the main resistance of 0.9810, however soon it returned to the area, predetermined by the experts, and came into a weekend at the level of 0.9775.


***

Forecast for the Upcoming Week:

Summing up the opinions of several dozen analysts from world leading banks and broker companies as well as forecasts based on different methods of technical and graphical analysis, the following can be suggested:


– as EUR/USD is keeping within the medium-term pivot area – the level of 1.1200, the indicators on both H4 and D1 have taken a neutral stance. As for the analysts, 90% of them expect the pair to fall to the support of 1.1100, and then down to the area of 1.1000. The main resistance will be at the level of 1.1280. With this, we should keep in mind that the Minutes of the Federal Open Market Committee meeting (Wednesday, October 12), the outcome of the EU Extraordinary Economic Summit (Thursday, October 13), as well as data on US economy and speech of the Federal Reserve Chair, Janet Yellen, on Friday, October 14, can influence formation of a short-term trend;


– GBP/USD. It is clear that after last Friday events the experts only lift their hands in dismay. In such situation the readings of the graphical analysis are of interest, the one on D1 predicts returning of the pair first to the resistance of 1.2700, and then even higher – up to the area of 1.2850. The thing happened to USD/CHF after January 2015 crisis also votes in favor of this forecast fairness. As a reminder, that time the market had quickly overcome panic sentiment, and just in two months the pair had regained almost all losses. The graphical analysis on H4 provides an alternative version for GBP/USD. According to its readings the pair can continue its downtrend, which had started on September 06. In this case it will decline to the support of 1.2340, and then down to the level of 1.2120;


– USD/JPY. Here just like last week the opinions of the experts split almost equally: just under half of them vote for the pair’s rise, just over half – for its fall. As for the graphical analysis on H4, it predicts that early week the pair will go up to the resistance of 103.70–103.90, and then decline – first to the level of 102.70, and then – to 101.75. The bottom will be at the level of 100.75. As for the graphical analysis on D1, according to it, this week the pair can get to the high of 106.40, and only then reverse to the south and look for the support of 101.75;


– the forecast for USD/CHF can be made using copy paste for weeks. As before, drawing a triangular pennant, the pair continues gradual consolidation at the area of 0.9640–0.9660. With this, almost 80% of experts are sure that in the longer term the bulls will win the victory and the pair will breakout upwards, reaching the high of 1.0100.


Roman Butko, NordFX


Notice: These materials should not be deemed as a recommendation for investment or guidance for working on financial markets and they are for informative purposes only. Trading on financial markets is risky and it can lead to loss of money deposited.
 

Julia NordFX

Broker Representative
Forex Forecast for EURUSD, GBPUSD, USDJPY and USDCHF for 08 - 12 May 2017


First, a review of last week’s forecast:


- Recall that the experts’ opinions on EUR/USD a week ago were divided almost equally: 35% supported the growth of the pair, 30% voted for its fall and 35% foresaw a sideways trend. At the same time, more than 80% of indicators were oriented to the north: they turned out to be right. The ECB President Mario Draghi' s speech, coupled with optimism about the second round of elections in France, provided the euro with such strong support that this pair chose to ignore even very positive data on the US labour market published on Friday 5 May. Thus, the pair finished the week session near 1.1000, having risen by about 100 points in five days;


- GBP/USD. 65% of experts, together with graphical analysis on H4, suggested that the pair would fail to overcome the resistance of 1.3055 and would stay in the side channel 1.2775-1.3055 for the entire week. This forecast proved to be quite accurate, although the pair's fluctuations proved even more sluggish than expected: as a result, the pair did not even manage to leave the 1.2830-1.2983 range;


- The forecast for the future of USD/JPY was surprising because of the fact that analysts' opinions coincided with indicator readings, which was something we had not seen for quite some time: more than 80% of them predicted a continuation of the uptrend for this pair. The forecast was 100% correct. Already on Thursday, having risen by 185 points, the pair managed to reach 113.00;


- The forecast for USD/CHF also turned out to be correct. The absolute majority of experts (75%) insisted on the continuation of the downtrend, identifying the levels of 0.9890 and 0.9820 as support levels. Thus, the pair fixed the local bottom near the middle of this range at 0.9858, and finished the week session at 0.9870.


***


Forecast for the coming week:

Summarizing the views of a number of analysts from leading banks and brokerage firms, as well as the forecasts made on the basis of a wide variety of technical and graphical analysis methods, we can say the following:


- The forecast for EUR/USD resembles the one that was given last week. More than 90% of indicators point northwards, while at the same time one third of oscillators on D1 signal the pair is overbought. As for analysts, a good 65% of them believe that the pair will try to secure a position above 1.0930 and 1.0850. And, just like last week, the medium-term forecast directly opposes the weekly one: here more than 60% of experts still expect the pair to fall into the 1.0400-1.0600 zone;


- Analysts express a similar opinion about the future of GBP/USD. The forecast for the coming days is as follows: 60% predict the growth of the pair, 40% predict its fall. The medium-term forecast, meanwhile, has 75% standing behind the fall of the pair and only 25% foreseeing its growth. Graphical analysis and almost 80% of trend indicators and oscillators agree with both the short and medium-term outlooks. The target for the coming days is the 1.3100-1.3150 zone, and the support levels are 1.2835 and 1.2770. In the medium term, we can expect a drop to the levels of 1.2570, 1.2375 and 1.2130;


- USD/JPY. The majority (60%) of experts believe that, seeing as the pair has reached the upper boundary of the descending channel that began at the end of December 2016, it should now be expected to descend. Graphical analysis on H4 and D1 agrees with such a forecast: according to its readings, the pair can fall first to 111.55, and then, after a short rebound, even further southwards to the 108.50 mark. An alternative point of view is represented by 40% of experts who, along with the indicators, expect the pair to grow to 115.00;


- Once again, the future of USD/CHF is expected to be a mirror image of EUR/USD: it will first go southwards to the support level of 0.9800, and then perform a 180-degree turn in order to return to the 1.0000-1.0100 zone. This scenario is supported by about 70% of analysts. However, in addition to the elections in France, whose results we expect to be announced on Monday, the second half of the week will also be filled with important economic and political events that are likely to affect the world’s major currencies. Thus, the most pessimistic forecast for the US dollar, supported by 30% of experts, does not exclude the fall of USD/CHF to 0.9550.


Roman Butko, NordFX


Notice: These materials should not be deemed a recommendation for investment or guidance for working on financial markets: they are for informative purposes only. Trading on financial markets is risky and can lead to a loss of money deposited.


#forex #forex_forecast #eurusd #signals_forex #binary_options

www.nordfx.com
 

Julia NordFX

Broker Representative
Forex Forecast for EURUSD, GBPUSD, USDJPY and USDCHF for 15 - 19 May 2017


First, a review of last week’s forecast:


- Recall that the experts' forecasts regarding the behaviour of EUR/USD in the short and medium term were fully opposed. Thus, in the first case, most of them favoured the growth of the pair, whilst in the second they favoured its fall. And, as it often happens, the medium-term forecast turned out to be the most accurate: until Thursday, the pair moved in a downtrend, losing more than 180 points over this period. However, on Friday, data on retail sales in the US was released, which played into the hands of bulls: instead of the expected 0.6%, consumer spending growth was only 0.4%: as a result, the pair drastically launched northwards and froze near the strong medium-term resistance line at 1.0932;


- A similar discrepancy among analysts was observed with respect to the future of GBP/USD. Apart from that, it was projected that the nearest support was at the level of 1.2835, and the resistance was 1.3100. However, just like two weeks ago, the pair ended up behaving more calmly than expected; it stayed within 1.2843-1.2986;


- For almost two months we have been stating in each of our forecasts for USD/JPY that experts are expecting its return first to 113.55, and then to 115.00. The pair has finally conquered the first of these heights and came close to the second one, reaching 114.36 just this week. After this victory, the strength of the bulls dried up, and the pair retreated downwards by 100 points, finishing the week at 113.35;


- An absolute majority (70%) of analysts expected the pair USD/CHF to return to the 1.0000-1.0100 zone. This forecast turned out to be 100% true: the maximum of this week ended up being 1.0098, and the pair met the end of the week’s session at 1.0007.


***

Forecast for the coming week:

Summarizing the views of a number of analysts from leading banks and brokerage firms, as well as the forecasts made on the basis of a wide variety of technical and graphical analysis methods, we can say the following:


- EUR/USD. The calendar for the upcoming week is not marked by any special economic or political events. This might be the reason why more than 50% of analysts, supported by almost half of the oscillators at D1, predict a lateral movement of this pair. The second fairly large group of experts (about 40%) believes that the pair will again test the height of 1.1000. 10% of experts still believe, though, that the pair will immediately head to the south. Interestingly, their point of view is supported by graphical analysis and almost half of the oscillators on H4, which indicate that this pair is overbought. Moreover, in the medium term, 65% of analysts expect it to fall. The nearest support is 1.0850, the medium-term goal is to return to the 1.0500-1.0680 zone;


- As for the future of GBP/USD, here the trend indicators on D1 insist on the continuation of the sluggish-upward trend, which began in the last decade of April. 30% of experts agree with this point of view, believing that the pair must necessarily break the 1.3000 barrier. An alternative point of view is represented by 70% of analysts, 60% of trend indicators and 90% of oscillators on H4. All of them insist it is best to start selling this pair and suggest the nearest support is 1.2755. If we look at the medium-term forecast, the number of bear supporters among the analysts already exceeds 80%; 1.2100 is declared the main target.


- USD/JPY. After this pair’s impressive spurt upwards in the first half of last week and a sufficiently strong retracement in the second, the indicator readings turned out to be diametrically opposite: on D1, they recommend buying the pair, whilst on H4 they recommend selling. Analysts cannot come to any consensus either: one third of them predict the fall of the pair, another third its growth, and the remaining third foresee a sideways trend. At the same time, about 60% of experts believe that, leaning against the support in the 111.60-111.79 zone, the pair still should try to conquer the height of 115.50 in the next few weeks;


- The last pair of our review, as usual, is USD/CHF. Just like its chart for the past week ended up being similar to the USD/JPY chart, so are the forecasts of the indicators regarding its future: D1 advises to buy and H4 advises selling. As for the experts and graphical analysis, in their opinion, the pair will first have to drop to the 0.9940-0.9960 zone, then claw its way back to 0.9990, before finally returning to the 1.0050-1.0100 area once again.


Roman Butko, NordFX


Notice: These materials should not be deemed a recommendation for investment or guidance for working on financial markets: they are for informative purposes only. Trading on financial markets is risky and can lead to a loss of money deposited.


#forex #forex_forecast #eurusd #signals_forex #binary_options

www.nordfx.com
 
Forex Forecast and Cryptocurrencies Forecast for April 30 - May 04, 2018


First, a review of last week’s forecast:

- as we said, the key event last week was the ECB President Mario Draghi press conference on Thursday, April 26. The pair EUR/USD had descended to the lower boundary of the three-month lateral channel around 1.2200 by that date. Recall that this behavior had been predicted by almost 100% of experts. But further on, their opinions diverged: 75% expected the pair to go up and return to the mid-term trading range, and 25% were confident that the euro would lose its positions further.
The dispute between the analysts was resolved by Mr. Draghi, who admitted that the Eurozone economy was unlikely to preserve the last year's growth rates. And although he said that the ECB will gradually reduce the QE quantitative easing program, many experts felt that its terms will likely be extended beyond 2018. As a result, the euro lost another 150 points. True, then a rebound occurred and the pair completed the week at 1.2130;

- GBP/USD. Strengthening of the dollar could not but affect the British pound. As a result, the forecast, for which about 40% of analysts voted, was implemented - the breakdown of the horizon is 1.4000 and the decline to support 1.3745, near which, at 1.3780, the pair and met the end of the weekly trading session.

- USD/JPY. 85% of analysts, graphic analysis and the clear majority of indicators had voted for the strengthening of the dollar and further growth of the pair to the heights in the 109.00 zone. This almost unanimous opinion was absolutely true, and the pair completed the five-day period at the height of 109.05;

- Cryptocurrencies. After the BTC/USD rose to 9,000, experts had expected the pair to roll back about 1,000 points down. However, this did not happen, and Bitcoin was in a sideways trend along the horizon of 9,000 for the whole of the week, making fluctuations in the range of about ± 500 points.
Other pairs behaved in a similar way. The level of 150.00 became Pivot Point for LTC/USD, and for XRP/USD, it was 0.845. And only Ethereum showed a noticeable recovery, reaching the mark of 709.83 on April 24. True, then a pullback followed, but despite this, the pair completed the week with an increase of about 10%.


As for the forecast for the coming week, summarizing the opinions of a number of analysts, as well as forecasts made on the basis of a variety of methods of technical and graphical analysis, we can say the following:

- EUR/USD. If only a quarter of experts voted for the transition of the pair to the zone of 1.1915-1.2085 last week, their number has increased to 60% now. About 80% of the indicators are painted red as well. Additional support for the dollar is provided by the expectation of data on the labor market in the US on Friday, May 4. According to forecasts, the number of new jobs created outside the agricultural sector (NFP) may increase from 103K to 198K, which does not exclude the fall of the pair by another 100-115 points lower, to support 1.1800.
This time 40% of experts and graphic analysis on D1 have sided with the bulls. In their opinion, the fall below the level of 1.2200 has been temporary, and the pair will return to the medium-term horizontal channel within a week or two and will reach a height of 1.2415. Oscillators confirm this possibility, 20% of which signal the pair is oversold;

- GBP/USD. It is clear that all the trend indicators have turned to the south following the last week's results. As for the experts' opinion, here the supporters of bears have a slight advantage - 55% versus 45% for bulls. Bull sentiment is also supported by a quarter of the oscillators, giving signals that the pair is oversold, as well as graphical analysis on H4 and D1.
If the "growth party" wins, the pair will go up, starting from the support of 1.3750, aiming to rise above the level of 1.4000 and, possibly, to reach the height of 1.4075. The nearest resistance is 1.3840.
If, however, the bears' expectations come true and the pair goes south, the support will be located at the following levels: 1.3585, 1.3455 and 1.3300;

- USD/JPY. 70% of analysts, supported by most of the indicators and graphical analysis on D1, expect the continuation of the uptrend. The targets are 109.80, 110.45 and 111.25. The remaining experts together with the graphical analysis on H4 believe that the pair has already reached a local maximum, and now it is expected to decline first to the level of 108.35, and even lower in case of its breakdown. The targets in this case are 107.40 and 106.60.
It should be noted that graphical analysis on D1 also does not exclude a drop to the level of 106.60, but only after the pair reaches heights in the area of 111.00, at least;
1524986742_USDJPY_30.04.2018.png

- Cryptocurrencies. Experts expect the growth of the BTC/USD first to the level of 10.000, and then 500-700 points higher. The main support is 8.620. In case of its breakdown, it is possible to decline to the level of 7.785.
The main forecast for the pair ETH/USD is an increase to the height of 785, the next target is 865. The nearest support is 594, the next one is 500. LTC/USD: the goal is to return to the April 24 high, 165.00, the support is 140.00. XRP/USD: the goal is to rise to the level of 0.92, and then to the zone 0.942-0.985, the support is 0.7230.


Dear traders, brokerage company NordFX offers you the opportunity to earn both on growth and on the fall of cryptocurrencies, using a leverage ratio of up to 1:1000.
Also, you can just invest in cryptocurrencies on favorable terms.
Deposit and withdrawal of funds in USD, bitcoins and ethereums.


Roman Butko, NordFX


Notice: These materials should not be deemed a recommendation for investment or guidance for working on financial markets: they are for informative purposes only. Trading on financial markets is risky and can lead to a loss of money deposited.

#eurusd #gbpusd #usdjpy #usdchf #forex #forex_example #signals #forex #cryptocurrencies #bitcoin

https://nordfx.com/
 
NordFX named Best News and Analysis Provider by FXDailyinfo


1525533459_Best_News___Analysis_Provider.png

NordFX has once again been recognised for the high quality of its services. The latest recognition came from international portal FXDailyinfo, which, after a round of voting, named the economic analysis and reviews of our experts the best in the industry.

The portal has been running the FXDailyinfo Awards series for several years now. The awards are based on open voting by the community, which decides which of the many companies in financial markets have distinguished themselves in a number of areas. This year, NordFX won by a large margin in the ‘Best News and Analysis’ category, having received nearly 70% of the popular vote.

We are sincerely grateful to all who voted for us for valuing the continuously hard work of our international analyst team. We hope that our output will continue to be both interesting and useful to the widest possible trading audience.

https://nordfx.com
 
Top