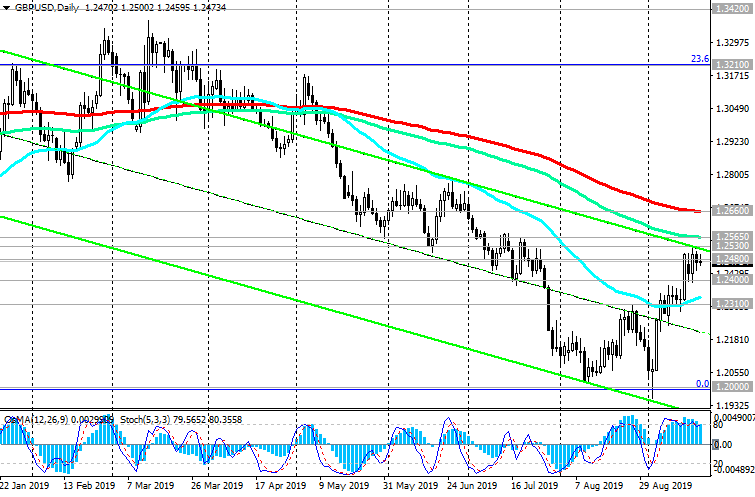
EUR/USD: negative dynamics prevail
08/22/2019
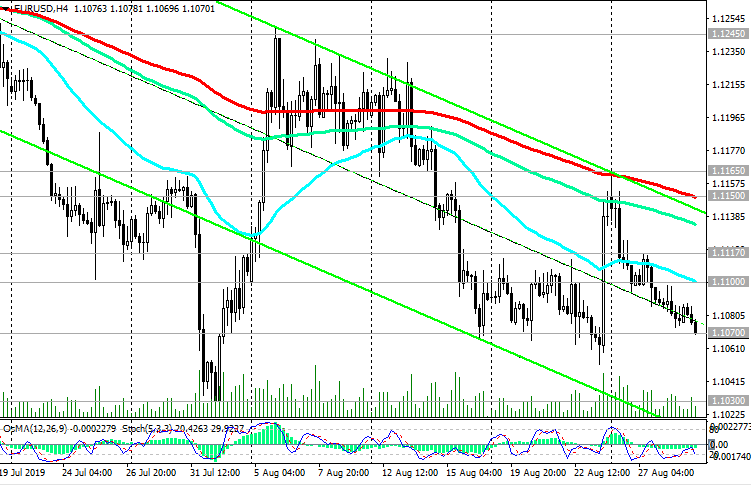
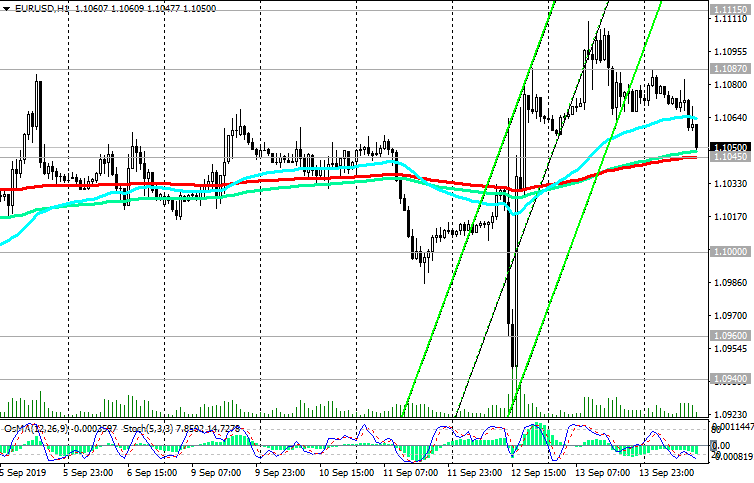
Expectations of further easing of the monetary policy of the ECB put pressure on the euro and the pair EUR / USD. Eurodollar strengthened at the beginning of today's European session after the publication of positive macro statistics from the Eurozone.
The preliminary German manufacturing purchasing managers' index (PMI) in August was 43.6 (against the forecast of 43.0 and 43.2 in July). A similar index in France was also better than forecast (51.0 against the forecast of 49.5 and 49.7 in July).
The pair EUR / USD reached an intraday maximum near 1.1113, but then fell again, moving to negative territory.
Despite the fact that the data were better than predicted, the German economy in August continues to slow down. "Despite some improvement, production data did not grow enough to avert the threat of another small drop in GDP in the 3rd quarter, especially given the deterioration of leading indicators", IHS Markit said.
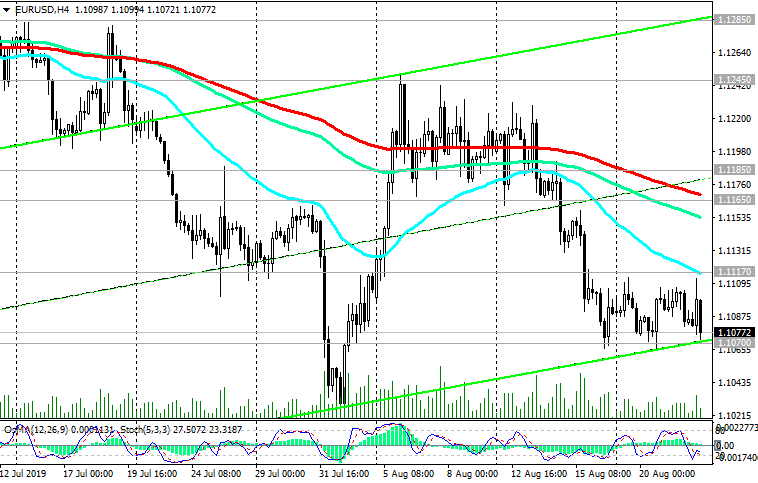
In the current situation, short positions are preferred, and the reduction targets are located at support levels of 1.1000, 1.0000.
Below the resistance levels of 1.1300 (EMA200 on the daily chart), 1.1285 (Fibonacci level 23.6% of the correction to the fall from the level of 1.3900, which began in May 2014), long-term negative dynamics persist.
Support Levels: 1.1070, 1.1000, 1.0000
Resistance Levels: 1.1117, 1.1165, 1.1185, 1.1245, 1.1285, 1.1300
Trading Recommendations
Sell by market. Stop-Loss 1.1125. Take-Profit 1.1070, 1.1000, 1.0000
Buy Stop 1.1125. Stop-Loss 1.1060. Take-Profit 1.1165, 1.1185


*) For up-to-date and detailed analytics and news on the forex market visit Tifia Forex Broker website tifia.com
08/22/2019
Expectations of further easing of the monetary policy of the ECB put pressure on the euro and the pair EUR / USD. Eurodollar strengthened at the beginning of today's European session after the publication of positive macro statistics from the Eurozone.
The preliminary German manufacturing purchasing managers' index (PMI) in August was 43.6 (against the forecast of 43.0 and 43.2 in July). A similar index in France was also better than forecast (51.0 against the forecast of 49.5 and 49.7 in July).
The pair EUR / USD reached an intraday maximum near 1.1113, but then fell again, moving to negative territory.
Despite the fact that the data were better than predicted, the German economy in August continues to slow down. "Despite some improvement, production data did not grow enough to avert the threat of another small drop in GDP in the 3rd quarter, especially given the deterioration of leading indicators", IHS Markit said.
In the current situation, short positions are preferred, and the reduction targets are located at support levels of 1.1000, 1.0000.
Below the resistance levels of 1.1300 (EMA200 on the daily chart), 1.1285 (Fibonacci level 23.6% of the correction to the fall from the level of 1.3900, which began in May 2014), long-term negative dynamics persist.
Support Levels: 1.1070, 1.1000, 1.0000
Resistance Levels: 1.1117, 1.1165, 1.1185, 1.1245, 1.1285, 1.1300
Trading Recommendations
Sell by market. Stop-Loss 1.1125. Take-Profit 1.1070, 1.1000, 1.0000
Buy Stop 1.1125. Stop-Loss 1.1060. Take-Profit 1.1165, 1.1185
*) For up-to-date and detailed analytics and news on the forex market visit Tifia Forex Broker website tifia.com