• The Forex, Binary Options Forum - welcomes you to our Community!

    DigitalCashPalace Forum is dedicated to discussions about Forex, Binary Options, commodities, stocks related.

    Please take a look around, and feel free to .

EUR/USD: Fed meeting

03/20/2019


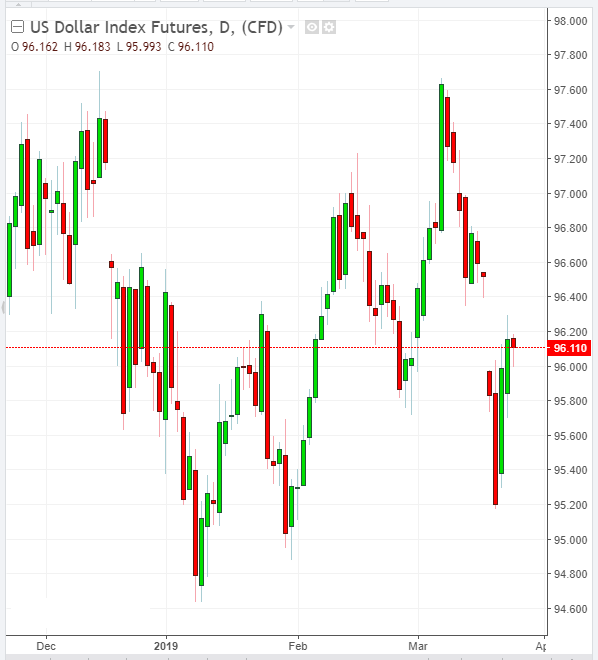
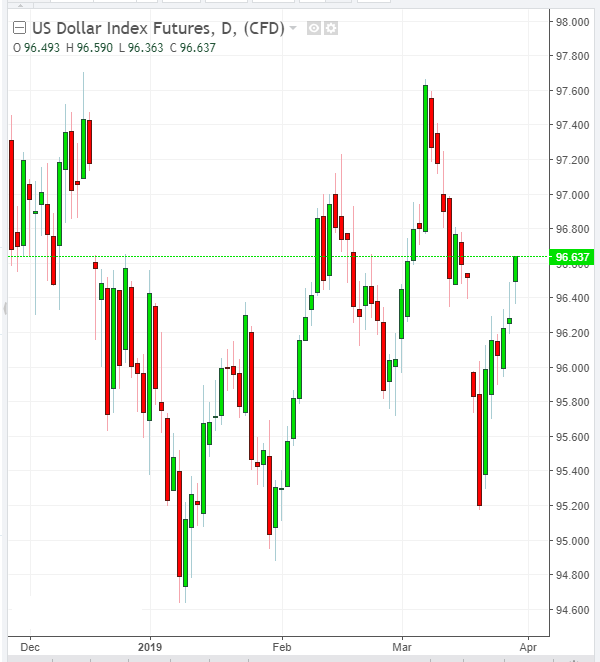
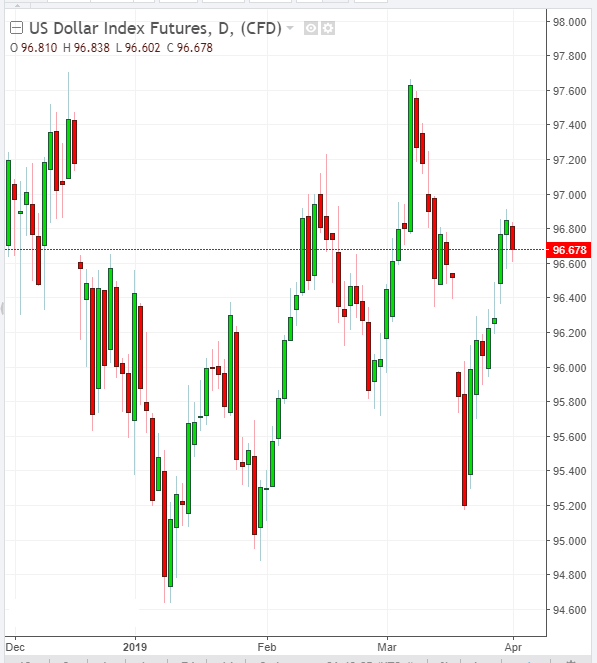
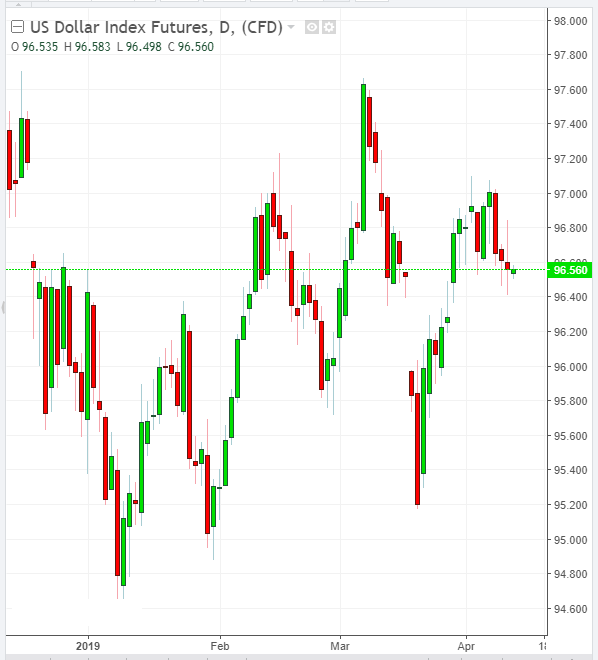
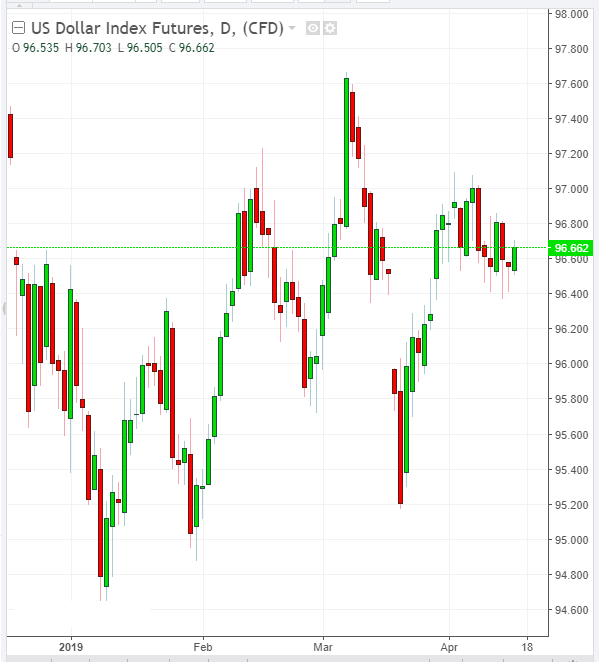
The dollar retains mainly the position before the publication at 18:00 (GMT) of the decision on the interest rate of the Fed. On Wednesday, futures for the dollar index DXY, which measures the value of the dollar against a basket of 6 major world currencies, is trading near 95.93, down 66 points from the closing price last Friday, but up 10 points from the closing price on Tuesday.

Market participants do not expect changes in monetary policy at this Fed meeting, which will end on Wednesday with the publication of a rate decision and a press conference. Its beginning is scheduled for 18:30 (GMT).

Probably, the Fed will again declare patience, as well as lower forecasts for interest rates and US economic growth. It is possible that the leaders of the Fed will declare that the key rate has reached its peak. To restore funding for the US economy from abroad, the dollar must weaken.

Earlier, US President Donald Trump also repeatedly criticized the Fed’s monetary policy against the backdrop of low inflation in the country.

Nevertheless, the demand for the dollar may remain in the medium and long term against the backdrop of international trade wars, regardless of the actions of the Fed. The US economy still looks more stable than other major global economies.

*)An advanced fundamental analysis is available on the Tifia Forex Broker website at tifia.com/analytics


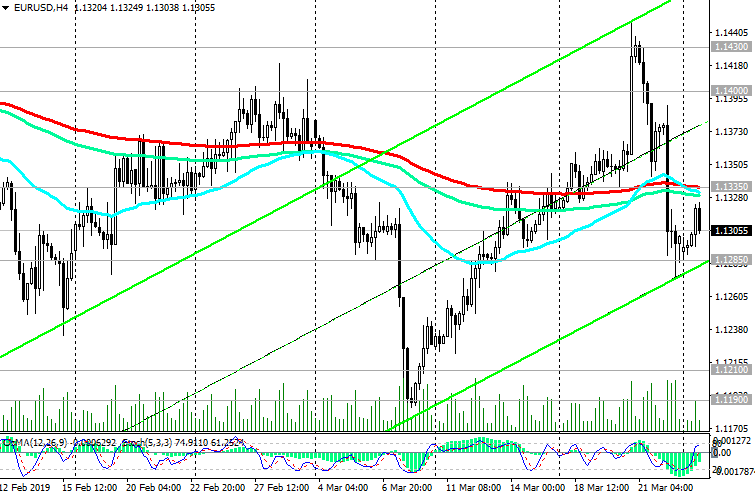
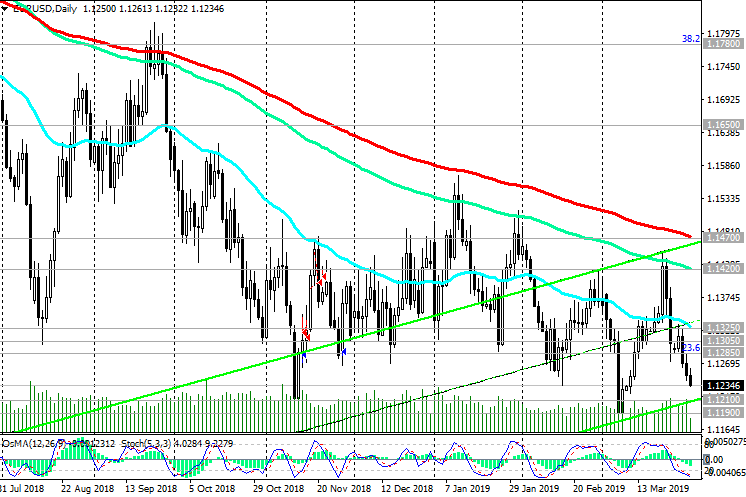
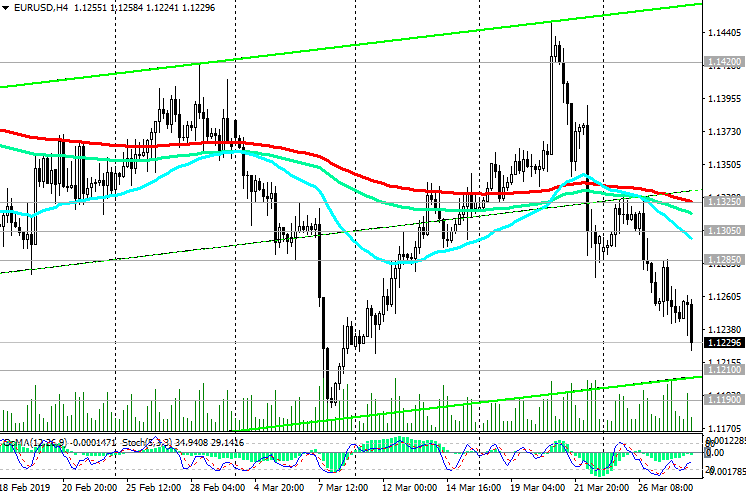
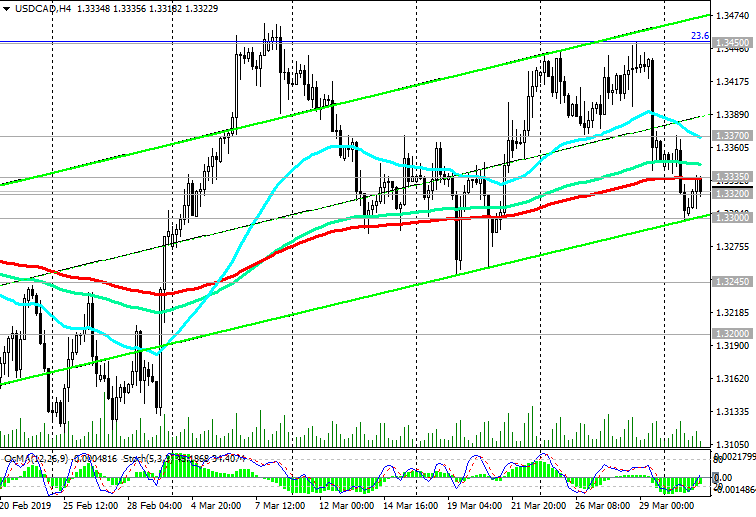
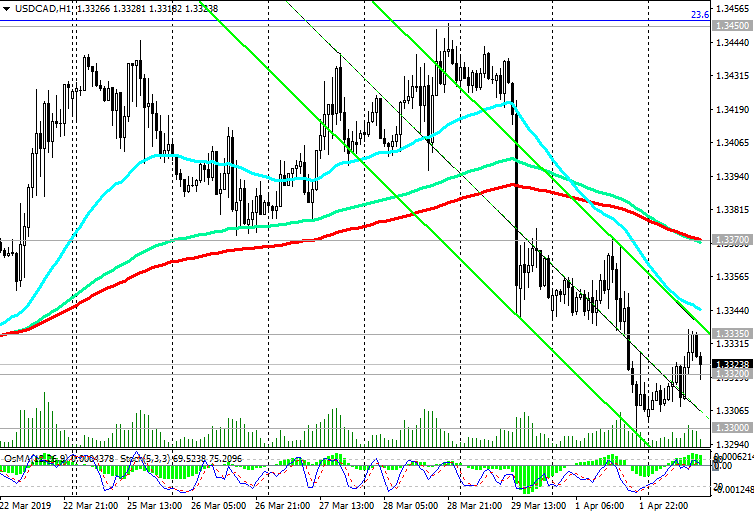
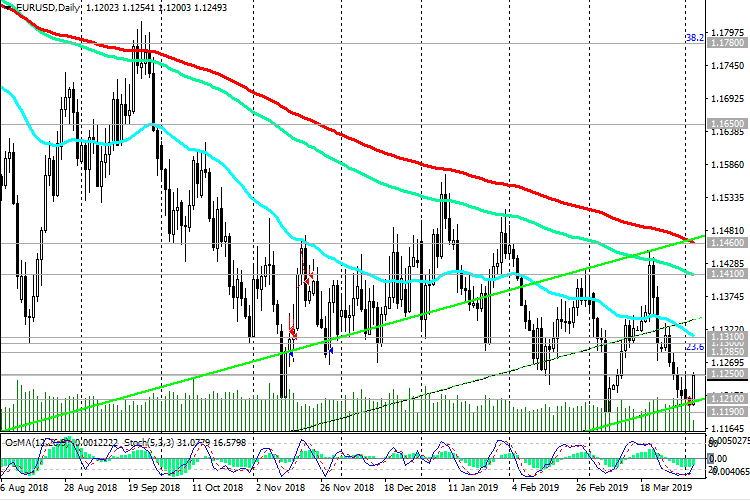
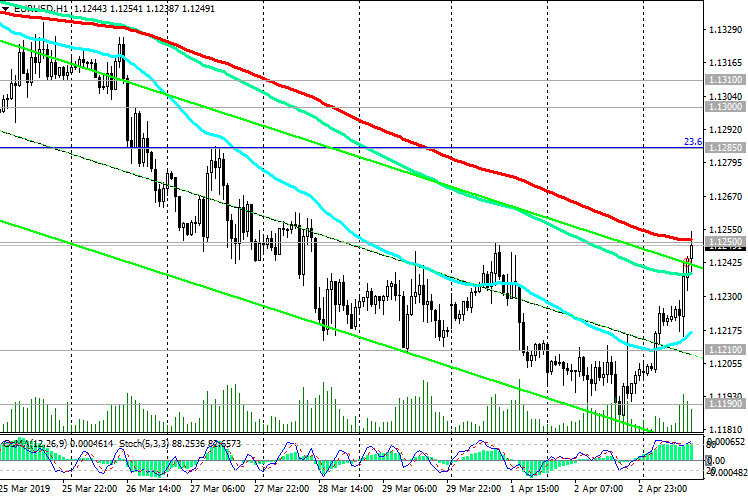
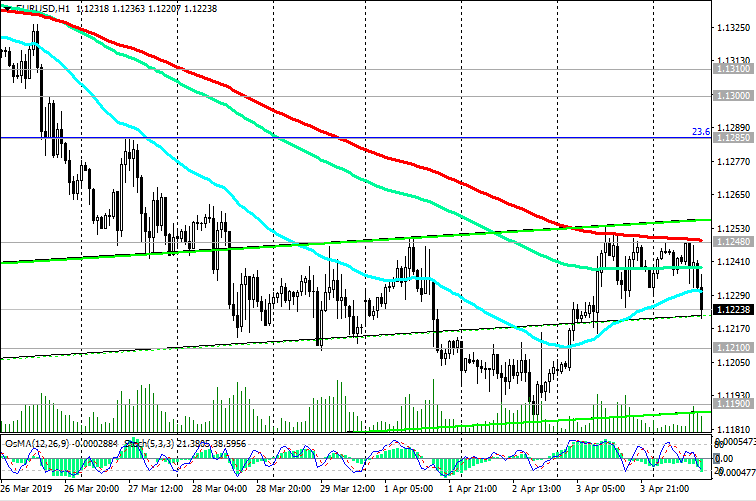
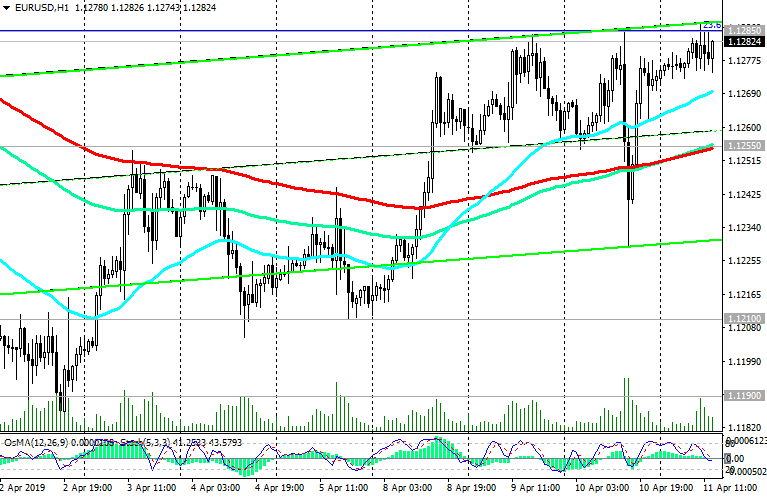
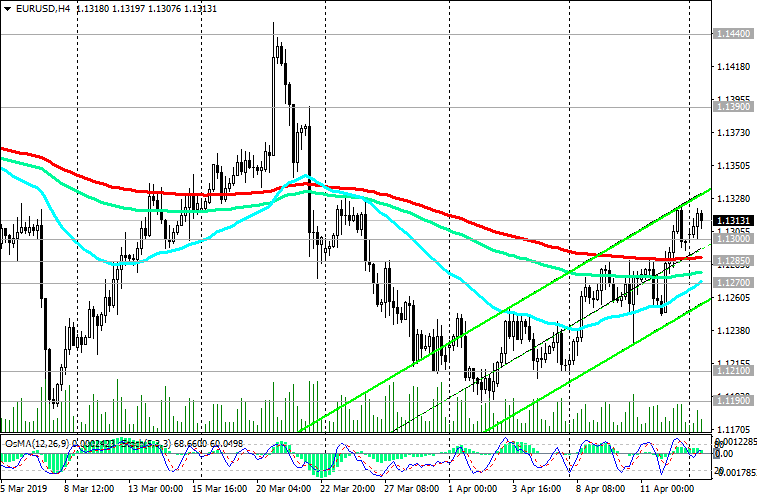
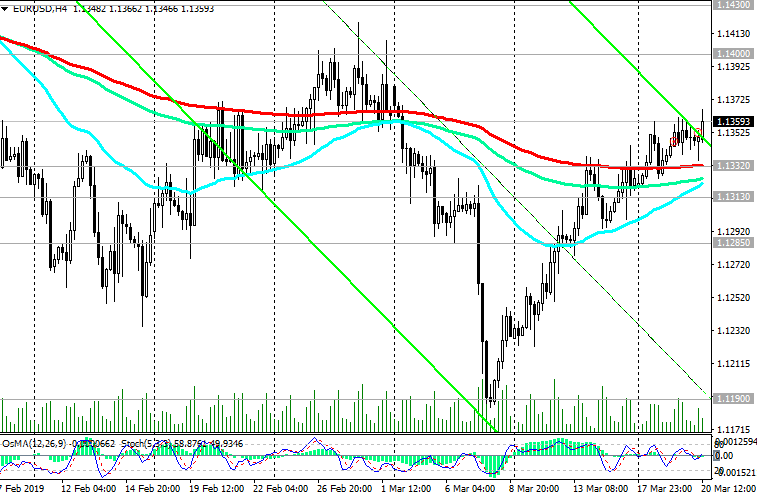
On Wednesday, the EUR / USD is trying to develop an upward trend above the support level of 1.1332 (ЕМА200 on the 4-hour chart). Below this level, downward dynamics prevail. The breakdown of the support level of 1.1313 (EMA200 on the 1-hour chart) will be a signal to resume sales.

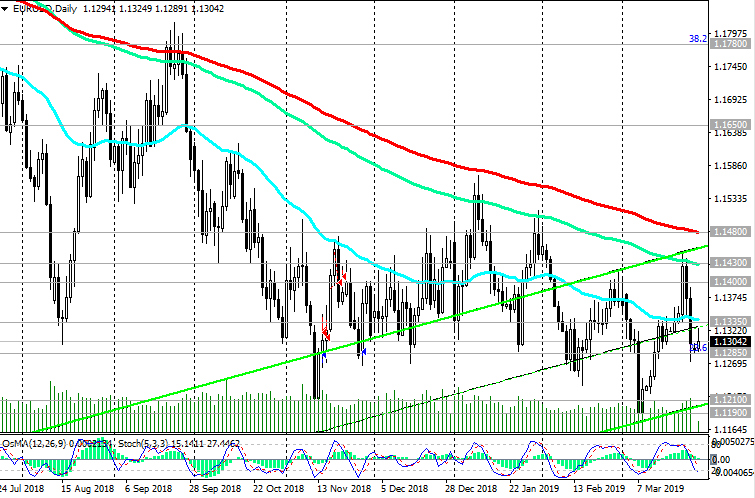
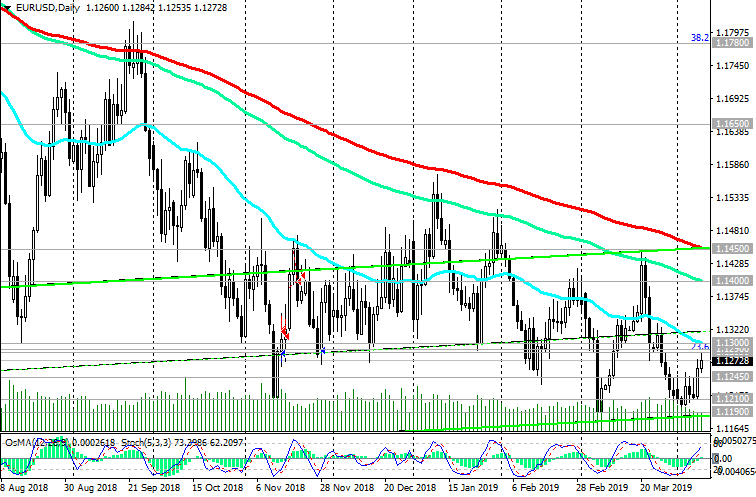
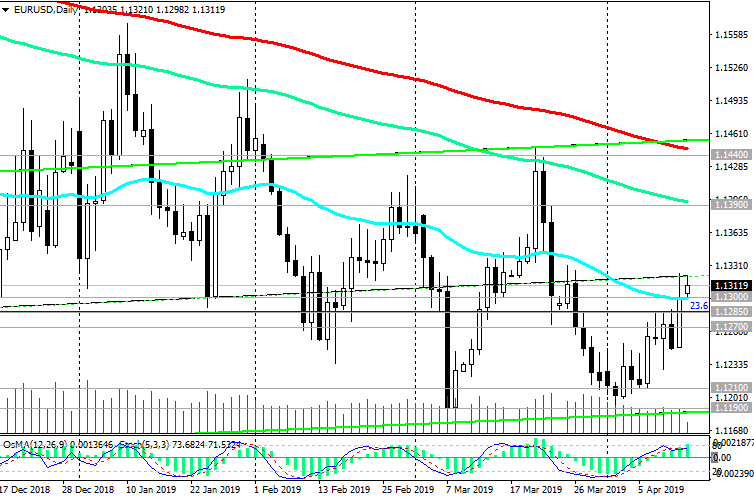
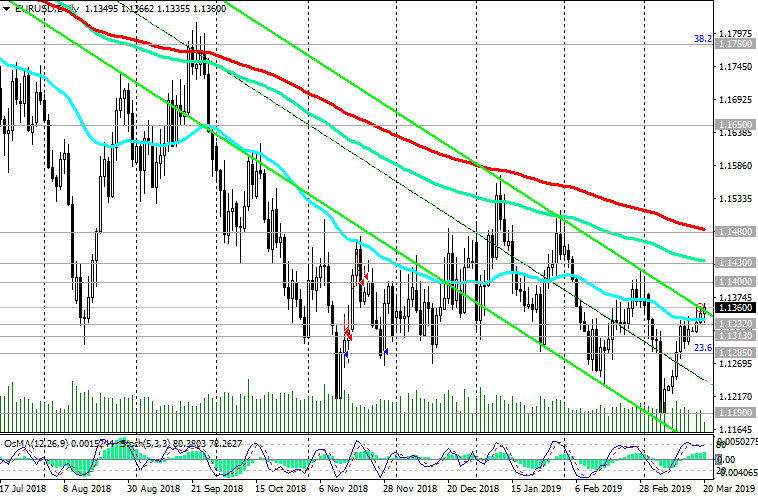
The targets for the decline after the breakdown of the support level of 1.1285 (the Fibonacci level of 23.6% of the correction to the fall from the level of 1.3900 that began in May 2014) will be the support levels of 1.1185, 1.1120, 1.1000.

The long-term bearish trend, which began in May 2014 near the 1.3870 mark, remains.

Short positions are preferred.

Long positions will become relevant after EUR / USD is fixed in the zone above the local resistance level of 1.1350.

Support Levels: 1.1332, 1.1313, 1.1300, 1.1285, 1.1260, 1.1225, 1.1185, 1.1120, 1.1000

Resistance Levels: 1.1350, 1.1400, 1.1430, 1.1480


Trading recommendations


Sell Stop 1.1330. Stop-Loss 1.1365. Take-Profit 1.1313, 1.1300, 1.1285, 1.1260, 1.1225, 1.1185, 1.1120

Buy Stop 1.1365. Stop-Loss 1.1330. Take-Profit 1.1400, 1.1430, 1.1480

200319-DXY.png


200319-EU-D.png


200319-EU-H4.png


*) For up-to-date and detailed analytics and news on the forex market visit Tifia Forex Broker website tifia.com
 
GBP/USD: anxiety is growing in the markets

03/21/2019


On Thursday, the dollar is rising, recovering from a strong fall on Wednesday. DXY dollar index futures at the beginning of the American session on Thursday traded near the level of 95.67, 32 points higher than the opening price of today.

Meanwhile, the Bank of England and the National Bank of Switzerland also retained their monetary policy unchanged. The decision of the SNB was published on Thursday at 08:30 GMT, and of the Bank of England at 12:00. The Swiss National Bank left the deposit rate at -0.75%, where it has been located since January 2015. It also left a three-month LIBOR rate in the range from -1.25% to -0.25%.

It is worth paying attention to the statement of the SNB, made by it after the meeting. The statement says that this decision and the decline in economic forecasts "is mainly due to the deterioration of the prospects for economic growth and inflation abroad, as well as the associated decrease in expectations regarding the interest rates of key economic regions".

The Bank of England also predictably retained its monetary policy unchanged. The decision was made by all 9 votes of members of the Bank of England Monetary Policy Committee (MPC). The bank’s statement says that “the outlook for the economy depends on how the UK leaves the EU”.

The pound almost did not respond to the decision of the Bank of England.

At the same time, anxiety is growing in the markets. Usually, the decision of the central bank of the United States, similar to the one adopted on Wednesday, would provoke growth in the stock markets, but this time the indices rose briefly and fell again. The yield on US government bonds reached 2.52%, the lowest level in a year, and the disappearing difference between long-term and short-term bonds indicates an increased likelihood of recession.

And yet, the demand for the dollar may remain in the situation of international trade wars and a slowdown in the global economy, regardless of the actions of the Fed. The US economy looks more stable than other major global economies.

*)An advanced fundamental analysis is available on the Tifia Forex Broker website at tifia.com/analytics


At the same time, the negative dynamics in the GBP / USD pair is growing due to renewed uncertainty about Brexit.

In case of breakdown of the support level of 1.3050 (EMA200 on the daily chart), the targets for further reduction will be the support levels of 1.2970, 1.2800, 1.2660, 1.2600.

In the alternative scenario, and after returning to the zone above the resistance level of 1.3210 (Fibonacci 23.6% of the correction to the decline of GBP / USD in the wave that started in July 2014 near 1.7200), the GBP / USD growth will resume with targets at the resistance levels of 1.3400 ( the upper limit of the ascending channel on the daily chart), 1.3660 (EMA200 on the weekly chart).

Short positions in the current situation looks preferable.

Support Levels: 1.3112, 1.3050, 1.2970, 1.2800, 1.2700, 1.2660, 1.2600

Resistance Levels: 1.3210, 1.3310, 1.3370, 1.3400, 1.3660


Trading scenarios


Sell Stop 1.3090. Stop Loss 1.3190. Take-Profit 1.3050, 1.2970, 1.2800, 1.2700, 1.2660, 1.2590, 1.2480

Buy Stop 1.3190. Stop Loss 1.3090. Take-Profit 1.3210, 1.3310, 1.3370, 1.3400, 1.3660

210319-DXY.png


210319-GU-D.png


210319-GU-H4.png


*) For up-to-date and detailed analytics and news on the forex market visit Tifia Forex Broker website tifia.com
 
USD/CHF: Swiss National Bank did not change monetary policy

03/22/2019

Current dynamics


On Thursday, a regular meeting of the Swiss National Bank took place, at which the bank maintained its monetary policy unchanged. The Swiss National Bank left the deposit rate at -0.75%, where it has been located since January 2015. It also left a three-month LIBOR rate in the range from -1.25% to -0.25%.

The bank’s statement said that this decision and the decline in economic forecasts “was mainly due to the deterioration of the prospects for economic growth and inflation abroad, as well as the associated decrease in expectations regarding interest rates in key economic regions”.

This statement was partly confirmed on Friday, when the weak, much worse than forecast, macro data came out, indicating an acceleration of the slowdown of the European economy.

The Swiss franc reacted with restraint to the decision of the NBS, which traditionally considers the franc to be overbought, which does not allow for a more active increase in the growth rate of the Swiss economy. GDP in the 4th quarter grew by only 1.4%, as recently reported in the government of the country.

The economic barometer KOF in February fell by 3.8 points and amounted to 92.4, continuing to decline from the long-term average of 100. Since September last year, the index has lost 10 points. "We can expect that the Swiss economy will show weakness in the coming months", said the KOF Economic Research Agency report.

Most likely, the interest rate of the NBS will not change in the near future.

Soft monetary policy of the central bank usually contributes to keeping the national currency rate low. Nevertheless, the franc maintains stability in the foreign exchange market, receiving support from franc buyers, who traditionally use it as a protective asset during periods of heightened turbulence in financial markets and the uncertainty of the political situation in the world.

Meanwhile, the dollar strengthened significantly over the past two days after falling on Wednesday, when the Fed unexpectedly announced its propensity for a softer monetary policy.

At the beginning of the European session on Friday, DXY dollar index futures traded near the 96.20 mark, 103 points higher than the minimum reached on Wednesday.

From the news for today we are waiting for the publication (at 13:45 GMT) of the PMI indices from Markit Economics for the USA. The preliminary manufacturing PMI index is expected to be 53.6 in March (against 53.0 in February), while the composite PMI index is expected to be 55.2 against 55.5 in February.

Data worse than forecasts can trigger a fall in the dollar and the closure of long positions on it at the end of the week.

*)An advanced fundamental analysis is available on the Tifia Forex Broker website at tifia.com/analytics


Support and Resistance Levels

At the beginning of the European session, the USD / CHF is trading near the level of 0.9945, through which the strong resistance level (EMA144 on the daily chart) passes.

The indicators OsMA and Stochastic on the 1-hour, 4-hour charts turned to long positions.

In the case of the breakdown of the resistance level of 0.9945, the growth of USD / CHF will continue, and the positive dynamics will again increase.

In the case of a confirmed breakdown of the key support level of 0.9920 (ЕМА200 on the daily chart and the Fibonacci level 50% of the upward correction to the last wave of decline since November 2018 and from 1.0130), the negative dynamics will increase. A break of this level will increase the risks of breaking the USD / CHF uptrend.

Support Levels: 0.9920, 0.9875, 0.9815, 0.9785, 0.9745, 0.9720

Resistance Levels: 0.9945, 0.9970, 0.9990, 1.0005, 1.0050, 1.0090, 1.0130, 1.0160


Trading Scenarios


Sell Stop 0.9910. Stop Loss 0.9955. Take-Profit 0.9875, 0.9800, 0.9780, 0.9745, 0.9720

Buy Stop 0.9950. Stop Loss 0.9910. Take-Profit 0.9990, 1.0005, 1.0050, 1.0090, 1.0130, 1.0160

220319-DXY.png


220319-UCF-D.png


220319-UCF-H1.png


*) For up-to-date and detailed analytics and news on the forex market visit Tifia Forex Broker website tifia.com
 
EUR/USD: Current trend

03/25/2019


At the end of last week, the dollar fell, moreover, it was already the second week in a row of dollar decline.

Last Wednesday, when the Fed meeting ended, DXY dollar index futures, which valued the dollar against a basket of 6 major world currencies, traded near the 95.17 mark, with a significant decrease to the closing price of the previous week.

The leaders of the American Central Bank unexpectedly stated that rates would not rise this year, and a one-time increase in interest rates may be next year.

Fed Chairman Jerome Powell said that the policy of the Central Bank may remain unchanged for many months.

Some participants in the financial market are betting that the Fed may soon reach a rate cut, which has not happened since the 2008 financial crisis. According to the CME Group, futures for federal funds show that market participants estimate the likelihood of Fed rate cuts by the end of the year at 57%, which is 11% higher than a month earlier.

On Monday, the decline in the dollar resumed. DXY dollar index futures traded at the beginning of the European session near the 96.11 mark, 5 points lower than the opening price on Monday.

*)An advanced fundamental analysis is available on the Tifia Forex Broker website at tifia.com/analytics


Meanwhile, the EUR / USD is recovering on Monday after a significant drop last Friday, when the PMI indices for Germany, France and the Eurozone were published.

The Purchasing Managers Index (PMI) for the German manufacturing sector, according to IHS Markit, fell to 44.7 in March from 47.6 in February, reaching the lowest level in more than 6.5 years. France's preliminary composite PMI dropped to 48.7 from 50.4 in February. An index value below 50 indicates slowdown and reduced activity. At the beginning of the European session, the EUR / USD pair is trading near the 1.1300 mark.

Below the resistance level of 1.1335 (EMA50 on the daily chart, EMA200 on the 4-hour and 1-hour charts) only short positions are recommended. The targets for the decline after the breakdown of the support level of 1.1285 (Fibonacci level of 23.6% of the correction to the fall from the level of 1.3900 that began in May 2014) will be the support levels of 1.1210 (November lows), 1.1190 (March and year lows), 1.1120, 1.1000.

Support Levels: 1.1300, 1.1285, 1.1260, 1.1210, 1.1190, 1.1120, 1.1000

Resistance Levels: 1.1335, 1.1400, 1.1430, 1.1480


Trading Recommendations


Sell Stop 1.1280. Stop-Loss 1.1340. Take-Profit 1.1260, 1.1210, 1.1185, 1.1120

Buy Stop 1.1340. Stop-Loss 1.1280. Take-Profit 1.1400, 1.1430, 1.1480

250319-DXY.png


250319-EU-D.png


250319-EU-H4.png


*) For up-to-date and detailed analytics and news on the forex market visit Tifia Forex Broker website tifia.com
 
NZD/USD develops upward momentum

03/26/2019


On the eve of the meeting of the RBNZ on the topic of monetary policy, the publication of data on the foreign trade of New Zealand was held. The Statistics Bureau of New Zealand reported on Tuesday that the trade surplus of the country in February amounted to 12 million New Zealand dollars (a deficit of 109 million New Zealand dollars was forecast). At the same time, exports amounted to $ 4.82 billion in February (compared with the forecast of 4.70 billion and the previous value of $ 4.33 billion).

Over the past two weeks, the New Zealand dollar has strengthened, which is associated by economists with optimism around the US-China trade negotiations.

The RBNZ interest rate decision will be published on Wednesday (01:00 GMT).

Probably, the rate will remain at the same level of 1.75%. Market participants expect the rate of the RBNZ to remain at the current level throughout 2019 and the first half of 2020.

*)An advanced fundamental analysis is available on the Tifia Forex Broker website at tifia.com/analytics


Meanwhile, NZD / USD is developing an upward trend above key support levels of 0.6865 (Fibonacci level 23.6% of the upward correction to the global wave of the pair's decline from the level of 0.8800, started in July 2014; the wave minima are near the level of 0.6260), 0.6815 (ЕМА200 on daily chart). Growth targets are at resistance levels of 0.6980 (EMA144 on the weekly chart), 0.7060 (EMA200 on the weekly chart).

The alternative scenario will be associated with the breakdown of the support level of 0.6815 and a decline to the support levels of 0.6750, 0.6700, which will increase the risk of NZD / USD returning to a bearish trend.

Support levels: 0.6900, 0.6865, 0.6840, 0.6815, 0.6750, 0.6700, 0.6630, 0.6575

Resistance levels: 0.6935, 0.6980, 0.7060


Trading scenarios


Sell Stop 0.6885. Stop Loss 0.6925. Take-Profit 0.6865, 0.6840, 0.6815, 0.6750, 0.6700, 0.6630, 0.6575

Buy Stop 0.6925. Stop Loss 0.6885. Take-Profit 0.6935, 0.6980, 0.7060

260319-10-Y.png


260319-NU-D.png


260319-NU-H4.png


*) For up-to-date and detailed analytics and news on the forex market visit Tifia Forex Broker website tifia.com
 
NZD/USD: RBNZ softened the rhetoric

03/27/2019

Current Dynamics


The New Zealand dollar fell significantly on Wednesday after the RBNZ left the key rate at 1.75% and indicated the likelihood of interest rate cuts

According to the RBNZ, "the outlook for the global economy continues to deteriorate". "Given the deterioration in the prospects for the world economy and the weakening of the impulse of spending inside the country, the more likely direction of our key interest rate will be its decline", the RBNZ said in a statement. Now some economists predict that by the end of this year, the RBNZ will lower rates twice.

*)An advanced fundamental analysis is available on the Tifia Forex Broker website at tifia.com/analytics


The NZD / USD fell by 1.6%, reaching a minimum near the level of 0.6793, breaking through the key support level of 0.6815 (ЕМА200 on the daily chart).

Indicators OsMA and Stochastic on the 4-hour and daily charts turned to short positions.

The negative scenario implies a further weakening of the New Zealand dollar, a breakdown of the support level of 0.6798 (EMA144 on the daily chart) and a decline to the support levels of 0.6750, 0.6700.

The breakdown of these support levels will mean the return of NZD / USD to a bearish trend.

If NZD / USD resumes upward trend, then growth targets will be resistance levels of 0.6865 (Fibonacci level 23.6% of the upward correction to the global wave of the pair's decline from 0.8800 level, which began in July 2014; wave minima are near 0.6260), 0.6935, 0.6980.

Support levels: 0.6798, 0.6750, 0.6700

Resistance levels: 0.6815, 0.6840, 0.6865, 0.6935, 0.6980


Trading Scenarios


Sell Stop 0.6785. Stop Loss 0.6825. Take-Profit 0.6750, 0.6700, 0.6630, 0.6575

Buy Stop 0.6825. Stop Loss 0.6785. Take-Profit 0.6865, 0.6935, 0.6980, 0.7060

270319-NU-D.png


270319-NU-H4.png


*) For up-to-date and detailed analytics and news on the forex market visit Tifia Forex Broker website tifia.com
 
EUR/USD: Current Dynamics

03/28/2019


The dollar is rising again in the second half of the European session, and the EUR / USD is trading near the 1.1235 mark. At the same time, futures for the dollar index DXY, reflecting the value of the dollar against a basket of 6 major world currencies, is trading near 96.64, 36 points higher than the closing price on Wednesday.

The US Federal Reserve last week also made it clear that this year it does not plan to raise rates.

Nevertheless, the US dollar is supported because of the deteriorating economic situation in Europe and the world, which makes investors more fearful of a slowdown in the global economy. In this situation, investors buy the dollar, because the United States is the largest economy in the world, from the end of 2017 ahead of other developed economies in terms of growth rates.

The American economy in the current situation looks more attractive.

On Thursday, market participants will pay attention to the publication (12:30 GMT) of the US annual GDP for the 4th quarter (final release). GDP data is one of the key (along with labor market and inflation data) for the Fed in terms of its monetary policy. A strong result strengthens the US dollar; a weak GDP report adversely affects the US dollar. In the previous quarter, GDP growth was +3.4%. The forecast for 4Q 2018 +2.4%. Despite the relative decline, this is a strong indicator. If the data turns out to be worse than the forecast, the dollar will respond with a decrease.

*)An advanced fundamental analysis is available on the Tifia Forex Broker website at tifia.com/analytics


Trading recommendations

EUR / USD is in a long-term bearish trend, trading lower for the second week in a row.

Below the key resistance levels 1.1420 (EMA144), 1.1470 (EMA200 on the daily chart) short positions are preferable.

The targets for the decline after the breakdown of the support level of 1.1210 (November lows) will be the levels of 1.1190 (March and year lows), 1.1120, 1.1000.

Support Levels: 1.1210, 1.1190, 1.1120, 1.1000

Resistance Levels: 1.1285, 1.1305, 1.1325, 1.1400, 1.1420, 1.1470


Trading recommendations


Sell in the market. Stop-Loss 1.1310. Take-Profit 1.1210, 1.1185, 1.1120

Buy Stop 1.1310. Stop Loss 1.1210. Take-Profit 1.1325, 1.1400, 1.1420, 1.1470

280319-DXY.png


280319-EU-D.png


280319-EU-H4.png


*) For up-to-date and detailed analytics and news on the forex market visit Tifia Forex Broker website tifia.com
 
GBP/USD: Current Dynamics

03/29/2019


On Friday, the British parliament will vote for the Brexit plan proposed by Theresa May for the third time, albeit in a truncated form. Voting will take place on one of the parts of the transaction, which spelled out such provisions as the rights of citizens, payments to the UK in the EU funds and measures to prevent the creation of a rigid border in Ireland.

If parliament votes in favor, the UK will leave the EU on May 22. If they don’t support it, then until April 12, London will have to offer an alternative agreement to Brussels.

This year, Parliament has twice rejected the plan for a deal with the EU proposed by Theresa May.

Voting in the British Parliament is scheduled for 13:30 (GMT). Any unexpected voting results or related comments may cause increased volatility in the GBP / USD.

*)An advanced fundamental analysis is available on the Tifia Forex Broker website at tifia.com/analytics


In the meantime, the pair GBP / USD is trading near 1.3100, above the key support levels of 1.3060 (EMA200 on the daily chart), 1.3035 (EMA144 on the daily chart).

Breakdown of these support levels may trigger a deeper decline. The targets are at the support levels of 1.3035, 1.2970 (March lows), 1.2800 (February lows), 1.2700 (October and August 2018 lows).

The breakdown of the short-term resistance level of 1.3125 (EMA200 on the 4-hour chart) will signal a resumption of purchases with targets at resistance levels of 1.3210 (Fibonacci level 23.6% of the correction to a decline in the GBP / USD pair in the wave that started in July 2014 near 1.7200) , 1.3370 (maximums of March and year), 1.3400 (upper limit of the ascending channel on the daily chart), 1.3660 (EMA200 on the weekly chart).

Support Levels: 1.3060, 1.3035, 1.2970, 1.2800, 1.2700, 1.2660, 1.2600

Resistance Levels: 1.3125, 1.3210, 1.3310, 1.3370, 1.3400, 1.3660


Trading scenarios


Sell Stop 1.3010. Stop Loss 1.3135. Take-Profit 1.2970, 1.2800, 1.2700, 1.2660, 1.2590, 1.2480

Buy Stop 1.3135. Stop Loss 1.3010. Take-Profit 1.3210, 1.3310, 1.3370, 1.3400, 1.3660

290319-GU-D.png


290319-GU-H4.png


*) For up-to-date and detailed analytics and news on the forex market visit Tifia Forex Broker website tifia.com
 
AUD/USD: current dynamics

01/04/2019


The US dollar declines on Monday after last Friday, the DXY dollar index, reflecting the value of the dollar against a basket of 6 major world currencies, reached a two-week high near the 96.91 mark. Investors prefer the US dollar amid risks of a slowdown in the global economy. The US economy looks more resilient than other major global economies.

On Monday at the beginning of the European session, futures for the dollar index DXY is trading near the mark of 96.68.

Received last Sunday and during the Asian session on Monday, positive macro statistics from China contributed to the growth of Chinese yuan and the currencies of the Asia-Pacific region, as well as a decrease in the US dollar.

The official Purchasing Managers Index (PMI) for the manufacturing sector in China rebounded noticeably in March, hardening to a 6-month high of 50.5 from 49.2 in February, exceeding the forecast of 49.5. The business activity index in the service sector also turned out to be in March (54.8) better than the forecast (54.1) and the previous value (54.3).

The index of purchasing managers (PMI) for the manufacturing sector of China from Caixin in March rose to 50.8 from 49.9 in February. The PMI index from Caixin in March reached the highest point since October, exceeding the level of 50, which separates the growth of activity from the decline.

As a result, the AUD / USD opened today with a gap up by 23 points, and at the beginning of the European session it was trading near the daily high of 0.7131.

However, by the beginning of the American session, the AUD / USD pair is again decreasing before the publication of important macro data from the USA (in the period from 12:30 to 14:00 (GMT)). Favorable statistics on retail trade and business activity in the US manufacturing sector are expected in March. PMI is expected to grow in the US manufacturing sector (from ISM) to 54.5 against 54.2 in February.

This is a strong indicator that will have a positive impact on the USD when the forecast is confirmed.

On Tuesday, a meeting of the RB of Australia on monetary policy will be held. According to the forecasts of economists, the RBA will keep the interest rate unchanged on Tuesday, at the level of 1.5%, but will hint at the likelihood of an early decrease in the interest rate. This will have a negative effect on AUD.

Publication of the RBA decision on the rate is scheduled for 03:30 (GMT).

*)An advanced fundamental analysis is available on the Tifia Forex Broker website at tifia.com/analytics


Despite the growth during the Asian session, AUD / USD remains under pressure below the key resistance level of 0.7230 (ЕМА200 on the daily chart). Mostly long-term negative dynamics.

In the event of a breakdown of the support level of 0.7110 (EMA50 on the daily chart), AUD / USD will go inside the downward channel on the daily chart towards the support levels of 0.7025, 0.6980, 0.6910 (September 2015 lows), 0.6830 (2016 lows). Short positions are preferred.

Support Levels: 0.7110,0.7100, 0.7025, 0.6980

Resistance Levels: 0.7140, 0.7180, 0.7230, 0.7295


Trading Recommendations


Sell in the market. Stop Loss 0.7150. Take-Profit 0.7100, 0.7055, 0.7025, 0.6910, 0.6830

Buy Stop 0.7150. Stop Loss 0.7090. Take-Profit 0.7180, 0.7230

010419-AU-D.png


010419-AU-H4.png


010419-DXY.png


*) For up-to-date and detailed analytics and news on the forex market visit Tifia Forex Broker website tifia.com
 
USD/CAD: Current Dynamics

02/04/2019


The PMI index for the US manufacturing sector, published on Monday, calculated by the Institute for Supply Management (ISM), rose to 55.3 in March against 54.2 in February.

The DXY dollar index, reflecting its value against a basket of 6 major world currencies, is at the beginning of the European session on Tuesday near 96.92, 12 points higher than the closing price on Monday. Today is the 6th day of the continuous growth of the DXY dollar index, and it looks like its positive dynamics will continue until the end of the week, when data from the American labor market will be published. Expected strong data that will support the US dollar in confirming the forecast.

From the news today we are waiting for important macro statistics from the United States. At 12:30 (GMT), data on durable goods orders will be published, involving large investments.

In January, the indicator came out with a value of +0.3%. Forecast for February: -1.8%. This is negative information for dollar buyers. If February’s data is even weaker, the US dollar may decline significantly.

Data better than the forecast will strengthen the dollar.

*)An advanced fundamental analysis is available on the Tifia Forex Broker website at tifia.com/analytics


Meanwhile, the USD / CAD continues to trade near the support levels of 1.3335 (EMA200 on the 4-hour chart), 1.3320 (EMA50 on the daily chart).

A break of the short-term resistance level of 1.3370 (EMA200 on the 1-hour chart) will confirm the scenario for the growth of USD / CAD. The growth targets will be the resistance levels of 1.3450 (Fibonacci level 23.6% of the downward correction to the growth of the pair in the global uptrend since September 2012 and 0.9700), 1.3660 (2018 highs), 1.3790 (2017 highs).

Confirmed breakdown of the local support level of 1.3300 will create prerequisites for further reduction to support levels of 1.3245 (EMA144 on the daily chart), 1.3200 (EMA200 on the daily chart).

In general, the positive dynamics of USD / CAD remains; long positions are preferred.

Support Levels: 1.3300, 1.3245, 1.3200, 1.3155, 1.3090, 1.3045

Resistance Levels: 1.3320, 1.3335, 1.3370, 1.3450, 1.3600, 1.3660, 1.3790


Trading scenarios


Sell Stop 1.3290. Stop Loss 1.3340. Take-Profit 1.3245, 1.3200, 1.3155, 1.3090, 1.3045

Buy Stop 1.3340. Stop-Loss 1.3290. Take-Profit 1.3370, 1.3450, 1.3600, 1.3660, 1.3790

020419-USC-D.png


020419-USC-H4.png


020419-USC-H1.png


*) For up-to-date and detailed analytics and news on the forex market visit Tifia Forex Broker website tifia.com
 
EUR/USD: Current Dynamics

03/04/2019


Eurozone's composite purchasing managers' index (PMI), which assesses activity in the manufacturing sector and the service sector, in March was 51.6 against 51.9 in February. A value above 50 indicates an increase in activity.

This was reported on Wednesday in the IHS Markit. The activity in the Eurozone service sector grew in March at the fastest pace since November last year, while in the manufacturing sector, the maximum decline in production since April 2013 was observed.

The euro strengthened at the beginning of the European session on positive data, indicating growth in the Eurozone services sector.

The index of purchasing managers for the Eurozone service sector rose to 53.3 from 52.8 in February.

Nevertheless, the leading manufacturing PMI indicators indicate that in the coming months, production in the Eurozone will continue to decline, which increases the downside risks for the European economy.

Macroeconomic data this week will remain the focus of market participants. On Friday (12:30 GMT) a report on the number of jobs outside of US agriculture in March will be released. Strong performance is expected, which will confirm the stability of the American economy against the background of a general slowdown in economic growth in other countries with major economies.

In view of this, the demand for the dollar may continue in the short term.

*)An advanced fundamental analysis is available on the Tifia Forex Broker website at tifia.com/analytics


Despite the growth of the euro on Wednesday, the long-term bearish trend of EUR / USD, which began in May 2014 near the 1.3870 mark, remains.

At the moment, EUR / USD is trying to break through the short-term resistance level of 1.1250 (EMA200 on the 1-hour chart). However, the growth will be limited by the resistance levels of 1.1285 (Fibonacci 23.6% of the correction to the fall from 1.3900, which began in May 2014), 1.1300 (EMA200 on the 4-hour chart), 1.1310 (EMA50 on the daily chart). Growth above the resistance level of 1.1310 is unlikely.

The reduction targets are at the support levels of 1.1210 (November lows), 1.1190 (March and year lows), 1.1120, 1.1000.

Support Levels: 1.1210, 1.1190, 1.1120, 1.1000

Resistance Levels: 1.1250, 1.1285, 1.1300, 1.1310, 1.1410, 1.1460


Trading recommendations


Sell in the market. Stop Loss 1.1270. Take-Profit 1.1210, 1.1190, 1.1120

Buy Stop 1.1270. Stop Loss 1.1235. Take-Profit 1.1285, 1.1300, 1.1310, 1.1410, 1.1460

030419-EU-D.png


030419-EU-H1.png


*) For up-to-date and detailed analytics and news on the forex market visit Tifia Forex Broker website tifia.com
 
EUR/USD: Current dynamics

04/04/2019


As follows from the minutes of the March meeting of the European Central Bank published on Thursday (11:30 GMT), its leaders at the March meeting discussed more aggressive incentive measures, expressing concern about the steady trend of a slowdown in the European economy.

The ECB leaders indicated that they can adjust their policies if necessary. The main interest rates of the ECB have long remained unchanged (0% and -0.4%).

Many market participants and economists do not expect monetary tightening to begin before 2020, amid signs of a slowdown in the European economy.

On Thursday, weak macro data were published, indicating a significant reduction in production orders in Germany.

According to the Federal Bureau of Statistics of Germany, orders in the manufacturing sector of Germany in February fell by 4.2% compared with January (the forecast was +0.5%). In annual terms, production orders fell in February by 8.4%, which is significantly worse than the forecast (-5.4%) and the previous value (-3.9%).

A number of German economic institutions lowered the forecast for German economic growth in 2019 to 0.8% from 1.9%, citing political risks. In addition, economists warn that the growth rate of the German economy, whose economy is the locomotive of the entire European economy, may turn out to be "markedly lower" than current forecasts in the case of a tough Brexit.

*)An advanced fundamental analysis is available on the Tifia Forex Broker website at tifia.com/analytics


Euro responded with a decrease to the information provided.

At the beginning of the American session, the EUR / USD pair is trading near the 1.1220 mark, below the short-term resistance level of 1.1248 (EMA200 on the 1-hour chart).

Negative dynamics prevails. Short positions are preferable, and the goals of decline are at the support levels of 1.1210 (November lows), 1.1190 (March and year lows), 1.1120, 1.1000.

Only a breakdown of the resistance level of 1.1310 (EMA50 on the daily chart) will create prerequisites for a stronger upward correction to the resistance levels of 1.1410 (EMA144), 1.1460 (EMA200 on the daily chart).

Support Levels: 1.1210, 1.1190, 1.1120, 1.1000

Resistance Levels: 1.1248, 1.1285, 1.1300, 1.1310, 1.1410, 1.1460


Trading recommendations


Sell in the market. Stop-Loss 1.1255. Take-Profit 1.1210, 1.1190, 1.1120

Buy Stop 1.1255. Stop Loss 1.1200. Take-Profit 1.1285, 1.1300, 1.1310, 1.1410, 1.1460

040419-EU-D.png


040419-EU-H1.png


*) For up-to-date and detailed analytics and news on the forex market visit Tifia Forex Broker website tifia.com
 
XAU/USD: Current Dynamics

05/04/2019


Futures on the dollar index DXY, reflecting its value against a basket of 6 major currencies, is traded on Friday in a narrow range, near the mark of 96.92. Investors are waiting for publication at 12:30 (GMT) of data from the US labor market.

It is expected that the number of new jobs outside the agricultural sector of the US economy in March was 180,000 (against +20,000 in February), while unemployment remained at the same level of 3.8%. These are strong indicators that can support the dollar.

If the growth of NFP is below 100,000, this may cause concern for investors and economists, indicating that the growth of the American economy is slowing.

*)An advanced fundamental analysis is available on the Tifia Forex Broker website at tifia.com/analytics


Meanwhile, the last 6 days, the XAU / USD pair is in a narrow range near the current levels due to the lack of strong drivers for further movement either down or up. Probably, today will provide investors with such guidelines. A strong report from the US labor market will strengthen the dollar and send a pair of XAU / USD to strong support levels of 1277.00 (EMA144 on the daily chart and Fibonacci 61.8% level of the correction to the decline wave since July 2016), 1274.00 (EMA200 on the daily chart).

Breakdown of the support level of 1266.00 (ЕМА200 on the weekly chart) will return XAU / USD to the global bearish trend that began in 2012 near the mark of 1795.00 and direct it to the support levels of 1197.00 (November lows), 1185.00 (Fibonacci 23.6%), 1160.00 (minimums of 2018).

The weak data on the labor market, on the contrary, will increase the attractiveness of gold. The immediate targets for the growth of XAU / USD will be resistance levels of 1323.00, 1345.00 (highs of February and 2019).

Support Levels: 1285.00, 1277.00, 1274.00, 1266.00, 1248.00

Resistance Levels: 1296.00, 1302.00, 1312.00, 1323.00, 1345.00, 1357.00, 1365.00, 1370.00


Trading recommendations


Sell Stop 1284.00. Stop-Loss 1297.00. Take-Profit 1277.00, 1274.00, 1266.00, 1248.00, 1234.00, 1220.00, 1197.00, 1185.00, 1160.00

Buy Stop 1297.00. Stop-Loss 1284.00. Take-Profit 1302.00, 1312.00, 1323.00, 1345.00, 1357.00, 1365.00, 1370.00


050419-XU-D.png


050419-XU-H1.png


*) For up-to-date and detailed analytics and news on the forex market visit Tifia Forex Broker website tifia.com
 
WTI: long positions are preferred

08/04/2019

Current dynamics


Against the background of increased geopolitical risks with oil supplies from a number of oil-producing countries, oil quotes rose sharply last week.

Even the US Department of Energy reports about a significant increase in oil reserves in the country last week, as well as a report by the American oilfield services company Baker Hughes, indicating an increase in active oil platforms in the United States to 831 units, could not stop the rise of the oil prices. Risks of oil supplies from Libya, where civil war rages, were added to the risks of restricting the supply of oil from Iran and Venezuela.

Investor expectations of a positive outcome of trade negotiations between the United States and China also contributed to the rise in oil prices. Last Friday, US President Donald Trump said that a compromise is possible with China to get out of the trade conflict.

Thus, last week, oil prices reached their next annual highs.

*)An advanced fundamental analysis is available on the Tifia Forex Broker website at tifia.com/analytics


On Friday, the price of Brent crude oil rose 1.7% to $ 70.90 a barrel, while WTI oil rose on Friday to $ 63.15 a barrel.

Despite the fact that on Monday the growth of prices stopped, a further increase in oil prices is likely.

The breakdown of the local resistance level of 63.50 (Fibonacci level of 61.8%) will create the prerequisites for further growth in the price of WTI crude oil.

Above key support levels of 59.00 (EMA200 on the daily chart), 59.50 (Fibonacci 50% of the upward correction to a fall from the highs of the past few years near 76.80 to the support level near 42.14) the long-term bullish trend remains.

Only a breakdown of support levels of 56.50 (EMA200 on the weekly chart), 55.40 (Fibonacci 38.2%) will revive the bearish trend.

While positive dynamics prevail, long positions are preferable.

Support Levels: 61.40, 59.50, 59.00, 56.50, 55.40

Resistance Levels: 63.50, 65.00, 66.00, 68.00


Trading scenarios


Sell Stop 61.30. Stop Loss 63.60. Take-Profit 61.00, 59.50, 59.00, 56.50, 55.40

Buy Stop 63.60. Stop Loss 61.30. Take-Profit 64.00, 65.00, 66.00, 68.00, 73.00

080419-WTI-D.png


080419-WTI-H1.png


*) For up-to-date and detailed analytics and news on the forex market visit Tifia Forex Broker website tifia.com
 
EUR/USD: on the eve of the ECB meeting

Current dynamics

09/04/2019


The Eurodollar is trading higher on Tuesday. On Wednesday, the next meeting of the ECB. According to many economists, it is not worth waiting for any decisive action by the leadership of the ECB. The ECB has already taken into account in its current policy downward risks for the growth of the European economy and inflation.

In March, the ECB has already taken some steps towards easing its monetary policy. Probably on Wednesday, ECB leaders can again discuss the details of the TLTRO.

However, an element of unexpected statements is still present in the market, which holds back the growth of the Eurodollar. ECB Head Mark Carney is able to turn back markets. Some of his previous statements moved the euro by 3-5% for the short time.

The Eurodollar is also weakly responding to the threat of the introduction of US import duties on European cars imported into the United States. On Tuesday, the White House administration proposed imposing duties on imports of goods from the EU in the amount of $ 11 billion in response to EU subsidies for Airbus. However, if the United States does impose import duties on cars imported from Europe, then the Eurozone economy can be dealt a significant blow, since the automotive industry is one of the key sectors of the European economy.

The ECB's decision on rates will be published on Wednesday (11:45 GMT), and at 12:30 the press conference of the ECB will begin. Any signals from the leadership of the ECB in favor of easing monetary policy will cause a sharp decline in the euro.

*)An advanced fundamental analysis is available on the Tifia Forex Broker website at tifia.com/analytics


On Tuesday, EUR / USD develops an upward trend, adjusting after a significant decline. Nevertheless, Eurodollar growth is constrained by strong levels of resistance

(Fibonacci level 23.6% of the correction to the fall from the level of 1.3900, which began in May 2014), 1.1290 (EMA200 on the 4-hour chart), 1.1300 (EMA50 on the daily chart).

Below these levels, short positions with targets located at support levels of 1.1210 (November lows), 1.1190 (March and year lows), 1.1120, 1.1000 are preferred.

If the ECB management on Wednesday make unexpected statements regarding monetary policy in the direction of its tightening, after the breakdown of the resistance level of 1.1300 EUR / USD will move to resistance levels of 1.1400 (EMA144), 1.1450 (EMA200 on the daily chart).

Support Levels: 1.1210, 1.1190, 1.1120, 1.1000

Resistance Levels: 1.1285, 1.1290, 1.1300, 1.1400, 1.1450


Trading recommendations


Sell in the market. Stop-Loss 1.1310. Take-Profit 1.1210, 1.1190, 1.1120

Buy Stop 1.1310. Stop Loss 1.1270. Take-Profit 1.1370, 1.1400, 1.1450

090419-EUD.png


090419-EUH4.png


*) For up-to-date and detailed analytics and news on the forex market visit Tifia Forex Broker website tifia.com
 
XAU/USD: the demand for gold is growing again

10/04/2019

Current Dynamics


In less than an hour, the ECB’s rate decision will be published. It is widely expected that the main interest rates of the ECB will remain at the same level of 0% and -0.4%, and the management of the ECB will again speak out in favor of maintaining a soft monetary policy.

At 16:00 (GMT) the EU summit dedicated to Brexit will begin. EU leaders during the summit will discuss the possibility of extending the UK exit from the block. The EU leaders are likely to give Britain more time.

At 18:00 (GMT), the minutes from the March meeting of the Federal Open Market Committee of the Fed will be published (“FOMC Minutes”).

Many economists expect US interest rates to remain unchanged in 2019 and to be reduced in 2020. This is a negative factor for the dollar and a positive one for gold quotes. The harsh rhetoric of Fed officials about the prospects for monetary policy will push the dollar to further growth, and gold prices may weaken. However, a significant drop in gold prices in the current environment (slowing global economy and rising political and trade tensions in the world) is also not expected.

*)An advanced fundamental analysis is available on the Tifia Forex Broker website at tifia.com/analytics


XAU / USD trades in a narrow range on the eve of important events, near the mark of 1306.00 dollars per ounce, above the short-term support levels of 1299.00 (EMA50 on the daily chart), 1301.00 (EMA200 on the 4-hour chart) and above the key support levels of 1277.00 (Fibonacci level 61, 8% of the correction to the wave of decline since July 2016), 1274.00 (EMA200 on the daily chart). Long term uptrend persists.

In the case of a breakdown of support levels of 1301.00, 1299.00, XAU / USD will decline in the direction of key support levels of 1277.00, 1274.00.

The XAU / USD growth targets are resistance levels of 1312.00, 1323.00, 1345.00 (highs of February and 2019).

Support Levels: 1301.00, 1299.00, 1285.00, 1277.00, 1274.00, 1266.00, 1248.00

Resistance Levels: 1312.00, 1323.00, 1345.00, 1357.00, 1365.00, 1370.00


Trading recommendations


Sell Stop 1298.00. Stop Loss 1308.00. Take-Profit 1285.00, 1277.00, 1274.00, 1266.00, 1248.00, 1234.00, 1220.00, 1197.00, 1185.00, 1160.00

Buy Stop 1308.00. Stop Loss 1298.00. Take-Profit 1312.00, 1323.00, 1345.00, 1357.00, 1365.00, 1370.00

100419-XU-W.png


100419-XU-D.png


100419-XU-H4.png


*) For up-to-date and detailed analytics and news on the forex market visit Tifia Forex Broker website tifia.com
 
EUR/USD: Trading Scenarios

11/04/2019


The soft rhetoric of the ECB leaders and their signals about the likelihood of easing of monetary policy, sounded on Wednesday, could not stop the growth of the Eurodollar. The EUR / USD pair has grown, mainly due to the weakening dollar. Fed leaders, according to the minutes of the March meeting of the American central bank, published on Wednesday, concerned about the slowdown in the global economy, which threatens to worsen the situation in the US economy. It follows from the protocols that the leaders of the central bank do not see the conditions for a further increase in interest rates.

*)An advanced fundamental analysis is available on the Tifia Forex Broker website at tifia.com/analytics


Having reached the level of 1.1190 at the beginning of the month (lows of March and 2019), EUR / USD turned "north" and continued to grow, up to the current European session.

Nevertheless, EUR / USD again failed to overcome the important resistance level of 1.1285 (Fibonacci level 23.6% of the correction to the fall from the level of 1.3900, which began in May 2014) and resumed its decline by the beginning of the American session.

A break of the short-term support level of 1.1255 (EMA200 on the 1-hour chart) will be a signal for the resumption of EUR / USD sales.

The growth scenario will be associated with fixing in the zone above the resistance level of 1.1300, which will create prerequisites for a stronger upward correction to resistance levels of 1.1395 (EMA144), 1.1450 (EMA200 on the daily chart).

Below resistance level 1.1285 short positions are preferable.

Support Levels: 1.1255, 1.1210, 1.1190, 1.1120, 1.1000

Resistance Levels: 1.1285, 1.1300, 1.1395, 1.1450


Trading recommendations


Sell in the market. Stop-Loss 1.1310. Take-Profit 1.1210, 1.1190, 1.1120

Buy Stop 1.1310. Stop Loss 1.1270. Take-Profit 1.1370, 1.1395, 1.1450

110419-DXY.png


110419-EU-D.png


110419-EU-H1.png


*) For up-to-date and detailed analytics and news on the forex market visit Tifia Forex Broker website tifia.com
 
AUD / USD: Current Dynamics

12/04/2019


Positive macro statistics from China contributes to the growth of commodity currencies and stock indices on Friday. AUD / USD traded at the beginning of the US trading session near the strong resistance level of 0.7170 (EMA144 on the daily chart) on a positive impulse received from the publication of strongly Chinese macro statistics.

In the event of a breakdown of this level, the next upside target for AUD / USD will be the key resistance level of 0.7217 (EMA200 on the daily chart), a rise above which is unlikely.

In the case of a rebound from the resistance level of 0.7170 and a return below the support level of 0.7127 (EMA200 on the 1-hour chart), short positions will again become relevant.

In this case, AUD / USD will go towards the support levels of 0.7025, 0.6980, 0.6910 (lows of September 2015), 0.6830 (lows of 2016).

Below resistance levels 0.7170, 0.7217 short positions are preferable. Long-term bearish trend persists.

Support Levels: 0.7140, 0.7127, 0.7112.0.7100, 0.7025, 0.6980

Resistance Levels: 0.7170, 0.7200, 0.7217, 0.7295


Trading recommendations


Sell in the market. Stop Loss 0.7220. Take-Profit 0.7140, 0.7127, 0.7112,0.7100, 0.7025, 0.6980

Buy Stop 0.7220. Stop Loss 0.7160. Take-Profit 0.7295

120419-AU-D.png


120419-AU-H1.png


*) For up-to-date and detailed analytics and news on the forex market visit Tifia Forex Broker website tifia.com
 
EUR/USD: Current dynamics

15/04/2019


The dollar fell by the end of last week. On Friday, the DXY dollar index closed with a 0.2% fall, at 96.97. According to the minutes of the March meeting of the American central bank, the Fed leaders are concerned about the slowdown in global economic growth, which threatens to worsen the situation in the US economy. It follows from the protocols that the leaders of the central bank do not see the conditions for a further increase in interest rates.

At the same time, US President Donald Trump reiterated his criticism of the Federal Reserve System, stating that "quantitative tightening was a murderer, the opposite should have been done". On Sunday, Trump tweeted that the economy and the stock market could have grown faster, "if the Fed had done its job properly".

On Monday, the dollar continues to decline, while DXY dollar index futures traded at the beginning of the European session near the 96.45 mark, 10 points lower than the opening price of the trading day.

On Monday, the publication of important macro data is not planned. Probably, trading in financial markets will be more relaxed than at the end of last week, which was full of important political and economic events.

Investors will also be less active on the eve of the Catholic Easter celebration this Sunday.

Meanwhile, the euro also remains under pressure after the ECB meeting last week. The ECB reported that the rate hikes before next year should not be expected, and the head of the European Central Bank, Mario Draghi, warned that the rate of economic growth in Europe this year will continue to decline. Mario Draghi last Wednesday signaled the possibility of implementing new measures to support the European economy in the event of a deterioration in its prospects.

*)An advanced fundamental analysis is available on the Tifia Forex Broker website at tifia.com/analytics


Trading scenarios

Against the background of the weakening dollar, the EUR / USD pair rose sharply last Friday, updating the 3-week high near the 1.1323 mark.

On Monday, the Eurodollar attempted to develop an upward movement, trading in the first half of the trading day above the support level of 1.1300 (EMA50 on the daily chart). Nevertheless, the Eurodollar failed to update the local and Friday maximum.

The OsMA and Stochastic indicators turned to short positions on the 4-hour and 1-hour charts.

Return under support level 1.1300 will be a signal for the resumption of short positions.

The breakdown of support levels of 1.1285 (Fibonacci level 23.6% of the correction to the fall from the level of 1.3900, which began in May 2014), 1.1270 (ЕМА200 per 1-hour chart) will confirm the scenario for the resumption of the EUR / USD decline.

The targets for reducing EUR / USD are at the support levels of 1.1210 (November lows), 1.1190 (March and year lows), 1.1120, 1.1000.

The growth scenario will be associated with the updating of the local maximum of 1.1323, which will create prerequisites for a stronger upward correction to the resistance levels of 1.1390 (EMA144), 1.1440 (EMA200 on the daily chart).

Support Levels: 1.1300, 1.1285, 1.1270, 1.1255, 1.1210, 1.1190, 1.1120, 1.1000

Resistance Levels: 1.1323, 1.1390, 1.1440


Trading recommendations


Sell in the market. Stop-Loss 1.1330. Take-Profit 1.1285, 1.1270, 1.1255, 1.1210, 1.1190, 1.1120, 1.1000

Buy Stop 1.1330. Stop Loss 1.1270. Take-Profit 1.1370, 1.1390, 1.1440

150419-DXY.png


150419-EU-D.png


150419-EU-H4.png


*) For up-to-date and detailed analytics and news on the forex market visit Tifia Forex Broker website tifia.com
 
AUD/USD: Support and Resistance Levels

16/04/2019


"The leadership of the central bank does not see any weighty arguments for adjusting monetary policy in the short term", says the RBA minutes, published Tuesday during the Asian session. After the publication of the minutes from the April meeting of the RBA, the Australian dollar weakened and the AUD / USD dropped by 30 points, to the level of 0.7142, through which the strong short-term support level passes (EMA200 on the 1-hour chart).

The indicators OsMA and Stochastic on the 1-hour, 4-hour charts turned to short positions. In the event of a breakdown of the support level of 0.7142, AUD / USD will move to the support level of 0.7120 (EMA200 on the 4-hour chart, EMA50 on the daily chart).

Break of this level will increase the risk of a return to the global bearish trend. In this case, AUD / USD will go towards the support levels of 0.7025, 0.6980, 0.6910 (lows of September 2015), 0.6830 (lows of 2016).

Below resistance levels 0.7170 (EMA144), 0.7217 (EMA200 on the daily chart) short positions are preferable.

*)An advanced fundamental analysis is available on the Tifia Forex Broker website at tifia.com/analytics


Support Levels: 0.7142, 0.7120, 0.7100, 0.7053, 0.7025, 0.6980

Resistance Levels: 0.7170, 0.7200, 0.7217, 0.7295


Trading Scenarios


Sell in the market. Stop Loss 0.7160. Take-Profit 0.7120, 0.7100, 0.7053, 0.7025, 0.6980

Buy Stop 0.7160. Stop Loss 0.7135. Take-Profit 0.7170, 0.7200, 0.7217

160419-DXY.png


160419-AU-D.png


160419-AU-H1.png


*) For up-to-date and detailed analytics and news on the forex market visit Tifia Forex Broker website tifia.com
 
Top