• The Forex, Binary Options Forum - welcomes you to our Community!

    DigitalCashPalace Forum is dedicated to discussions about Forex, Binary Options, commodities, stocks related.

    Please take a look around, and feel free to .

Market analysis and trade recommendations by FBS

USD/JPY: DOLLAR IS CORRECTED TO KIJUN-SEN
06:31 22.09.2017

Technical levels: support – 112.00; resistance – 112.70.

Trade recommendations:

Buy — 112.00; SL — 109.80; TP1 — 112.70; TP2 — 113.40.
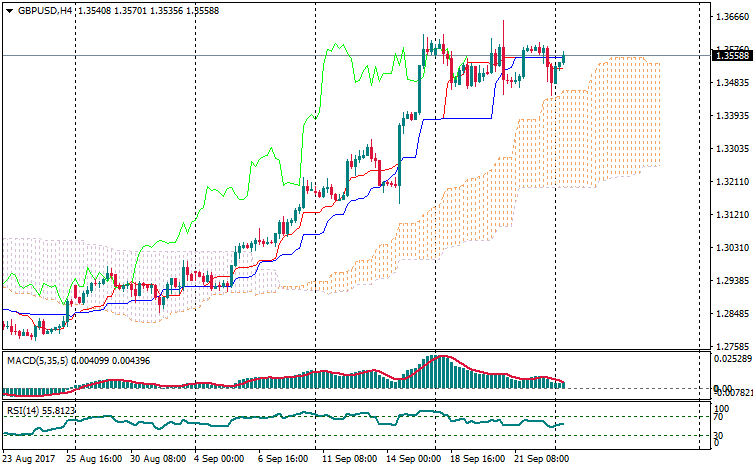
Reason: expanding bullish Ichimoku Cloud with rising Senkou Span A; a cancelled golden cross of Tenkan-sen and Kijun-sen; the prices are returned to the support of Tenkan and Kijun and may go higher.

1506061799-3dcc4d3b0e9d38341d309e86e7227f36_1200x1200_q90v3.png


More:
https://fbs.com/analytics/articles/usd-jpy-dollar-is-corrected-to-kijun-sen-3909
 
EUR/USD: "V-BOTTOM" PUSHED PRICE HIGHER
07:05 22.09.2017

1506063874-dde83825b946fc5b16045e949fbf4419_1200x1200_q90v3.png


The main trend is still bullish, so we've got a "V-Bottom" pattern, which pushed the price higher. So, the market is likely going to continue rising towards the next resistance at 1.2021 - 1.2033. If a pullback from this area happens, we could have a decline towards the nearest support at 1.1925 - 1.1909.

1506063875-f74cc26046165239cc47eb2c825f8363_1200x1200_q90v3.png


We've got a "Triple Bottom", which has been confirmed, but bulls faced with resistance at 1.1968. In this case, the price is likely going to test the closest support at 1.1941 - 1.1934. However, if we have a pullback from these levels, bulls will try to achieve another resistance at 1.2021 - 1.2033.

More:
https://fbs.com/analytics/articles/eur-usd-v-bottom-pushed-price-higher-3910
 
GBP/USD: BULLISH "PENNANT"
07:07 22.09.2017

1506063874-0344af6ccf7a042578af5d33259645e3_1200x1200_q90v3.png


The price is consolidating between the levels 1.3652 - 1.3444. Tha main intraday target is the nearest resistance at 1.3625 - 1.3681. If a pullback from this area arrives little later on, there'll be an opportunity to have a decline in the direction of the closest support at 1.3533.

1506063874-8ddf95f3c449914d418d4be4c8731846_1200x1200_q90v3.png


There's a bullish "Pennant", so the pair is likely going to reach the nearest resistance at 1.3625 -1 .3681. Meanwhile, if we see a pullback from these levels, bears will probably try to deliver a downward correction.

More:
https://fbs.com/analytics/articles/gbp-usd-bullish-pennant-3911
 
EUR/USD: DEVELOPING TRIANGLE IN WAVE 4
07:26 22.09.2017

1506065170-53b14d622912957806ab3b51a52ae8a2_1200x1200_q90v3.png


There's a pullback from 7/8 MM Level, so we've got a developing triangle in wave 4. It's likely that the price is going to test the lower side of this pattern. If a pullback from this level happens, there'll be an opportunity to have an upward impulse in wave 5.

1506065171-f43666d738b7c8554d96a2d1f8210e25_1200x1200_q90v3.png


The price is consolidating between the 5/8 and 2/8 MM Levels. Wave [d] of 4 is about to end, so we could have wave [e] of 4 in the short term. If another pullback from 3/8 MM Level arrives later on, bulls will try to deliver wave .

More:
https://fbs.com/analytics/articles/eur-usd-developing-triangle-in-wave-4-3912
 
EUR/USD IS MAKING A CHOICE
07:38 22.09.2017

Recommendation:

SELL 1.1825 SL 1.188 TP 1.171

BUY 1.2025 SL 1.197 TP 1.2155

On the daily chart, EUR/USD broke below the diagonal support and left the uptrend channel. This increases the possibility of a “Shark” and “Head and Shoulders”. Their realization will lead to a pullback towards 1.1710. To resume the uptrend, bulls need to conquer resistance at 1.2030.

1506065880-8afba167b3e7c15d0d5d28d0f3c7b966_1200x1200_q90v3.png


On H1, EUR/USD formed a “Widening wedge”. To trigger it, the pair needs a confident test of support at 1.1825-1.1840.

1506065901-144c086f9efd0dd7367f2818eb875c0e_1200x1200_q90v3.png


More:
https://fbs.com/analytics/articles/eur-usd-is-making-a-choice-3913
 
EUR/GBP: BULLS BEFRIEND A DRAGON
07:50 22.09.2017

????????????:

BUY 0.89

SL 0.8845

TP1 0.8985 TP2 0.904

On the daily chart, bulls are trying to catch hold of 0.8810 (50% of the last bullish wave). To counterattack in order to resume the uptrend, they need to conquer resistance at 0.8900. On the other hand, a break of support at 0.8775 will increase the risks of continuation of the decline.

1506066562-bc1ce4ebdd72b71af2881b8edc2b5fe5_1200x1200_q90v3.png


On H1, a break of resistance at 0.8900 will create the potential for the realization of the “Dragon” pattern. However, for a start bulls have to defend current positions and form a “Double bottom”.

1506066589-311438cdc50bb0f634d8ee27e47a0113_1200x1200_q90v3.png


More:
https://fbs.com/analytics/articles/eur-gbp-bulls-befriend-a-dragon-3915
 
EUR/USD: PRICE GOING TO TEST 34 MA
09:50 22.09.2017

1506073763-194cf7ea790e59785e4ea65083f4f221_1200x1200_q90v3.png


The 89 Moving Average has acted as support, so we've got a "High Wave" pattern, which pushed the price to the nearest resistance. In this case, the market is likely going to test the 34 MA, which could be a departure point for another upward price movement.

1506073763-58e831b5837eefd8f14e4815d5c1f1ab_1200x1200_q90v3.png


There's a "Shooting Star" at the local high, but this pattern hasn't been confirmed enough. Therefore, we're likely going to have a bearish correction towards the Moving Averages. If a pullback from these lines happens, bulls will probably try to reach the upper "Window".

More:
https://fbs.com/analytics/articles/eur-usd-price-going-to-test-34-ma-3921
 
USD/JPY: "WINDOW" ACTED AS RESISTANCE
09:52 22.09.2017

1506073764-ae722c054c3990dcdebb5bf7d7041d9a_1200x1200_q90v3.png


The upper "Window" has acted as resistance, so we've got a "Shooting Star" pattern, which has been confirmed. However, bulls are likely going to test the "Window" once again in the short term. If we have another pullback from this level, there'll be an opportunity to have a decline towards the Moving Averages.

1506073763-c425da23bf241a718492cc6ce4630ae3_1200x1200_q90v3.png


The 55 Moving Average has acted as support, so we've got a bullish "Harami". Under this circumstance, the market is likely going to rise towards the last high during the day.

More:
https://fbs.com/analytics/articles/usd-jpy-window-acted-as-resistance-3922
 
EUR/USD: BULLS GOING TO DELIVER WAVE 5
05:19 25.09.2017

1506316680-dfc87a3caea6d4c19c941b01313a3826_1200x1200_q90v3.png


There's a possible triangle pattern in wave 4. So, if the price fixates above 6/8 MM Level, bulls are likely going to deliver wave 5. In this case, we should keep an eye on 8/8 MM Level as an intraday target.

1506316680-c9f6b7f6d70cd0255b61b10cefa4d9fa_1200x1200_q90v3.png


2/8 MM Level acted as support, so the triangle may have been ended. Therefore, we're likely going to have an upward impulse in wave in the coming hours. If another pullback from 5/8 MM Level arrives later on, there'll be an opportunity to have a local bearish correction.

More:
https://fbs.com/analytics/articles/eur-usd-bulls-going-to-deliver-wave-5-3941
 
GBP/USD: READY TO GO
06:36 25.09.2017

Technical levels: support – 1.3520; resistance – 1. 3600.

Trade recommendations:

Buy — 1.3540/50; SL — 1.3520; TP1 — 1.3650; TP2 — 1.3700.
Reason: bullish Ichimoku Cloud with rising Senkou Span B; a correctional dead cross of Tenkan-sen and Kijun-sen, the lines are horizontal; the market supported by the Cloud and ready to make the new highs.

1506321382-5838ef800660551113de2aff99712827_1200x1200_q90v3.png


More:
https://fbs.com/analytics/articles/gbp-usd-ready-to-go-3945
 
AUD/USD: GAME WILL CONTINUE UNDER CLOUD
06:37 25.09.2017

Technical levels: support – 0.7930; resistance – 0.8000, 0.8040.

Trade recommendations:

Sell — 0.7960; SL — 0.7980; TP1 — 0.7900; TP3 — 0.7870.
Reason: expanding bearish Ichimoku Cloud with falling Senkou Span A; a new dead cross of Tenkan-sen and Kijun-sen; the prices are in the negative area and the bears will continue selling the Aussie.

1506321382-42a68b4bfa2f0515dfbaa054e9dbae66_1200x1200_q90v3.png


More:
https://fbs.com/analytics/articles/aud-usd-game-will-continue-under-cloud-3946
 
NZD/USD: BEARS RETURN TO THE GAME
10:23 25.09.2017

Recommendation:

SELL 0.728 SL 0.7335

TP 0.719 TP2 0.7105

TP3 0.705

On the daily chart, the inability of bulls to push the pair above the resistance level at 0.7280 was a signal of their weakness. In case of a break of the lower border of the short-term trend channel, bears will have a chance to form an AB=CD pattern.

1506334939-fb9be1d9d65d6402746f6573306cf53b_1200x1200_q90v3.png


On H1, NZD/USD there are pattern “Head and Shoulders” and “Shark”. Further dynamics of the pair will depend on bulls’ ability to keep the pair above support at 0.7185-0.7205. If they fail, triggering of the “Widening wedge” pattern will allow bears to continue correction.

1506334955-3696dc2326705fd45dfa7b732beb8b1e_1200x1200_q90v3.png


More:
https://fbs.com/analytics/articles/nzd-usd-bears-return-to-the-game-3951
 
AUD/USD: FIGHTING CONTINUES
10:48 25.09.2017

Recommendation:

SELL 0.795 SL 0.8005 TP1 0.7875 TP2 0.782

BUY 0.8055 SL 0.8 TP1 0.8155 TP2 0.824

On the daily chart, AUD/USD triggered Gartley pattern with a target at 78.6%. The necessary condition for its formation is the decline of the pair below support at 0.7937. On the other hand, if bulls manage to return the pair inside the bullish trend channel, a rally towards 161.8% of the AB=CD pattern will continue.

1506336459-1db64c049cc9775b27418fd0e6b0833a_1200x1200_q90v3.png


On H1, AUD/USD is forming a “Widening wedge” pattern. The decline of the pair below 0.7950 will be a signal for correction. Buying is possible from 78.6% and 88.6% of the wave 4-5.

1506336489-ef00342837a633bda01cab6a3fe3e88f_1200x1200_q90v3.png


More:
https://fbs.com/analytics/articles/aud-usd-fighting-continues-3953
 
EUR/USD: NEW "BREAKAWAY GAP"
13:19 25.09.2017

1506345481-7d98c66344b63312742bc1f8b5dc45a3_1200x1200_q90v3.png


There's a "V-Top" pattern, so a new "Breakaway Gap" was formed this morning. The 89 Moving Average is acting as support, but bears are likely going to test the next support at 1.1837 - 1.1822. If a pullback from this area happens, we could have an upward price movement towards the closest resistance at 1.1909 - 1.1925.

1506345481-9fb6f9e22f7d4207a950f5c24edef263_1200x1200_q90v3.png


The downward trend has been broken, so the price is still declining. The main bearish target is the nearest support at 1.1837 - 1.1822. If we have a pullback from this area, there'll be an opportunity to have an upward correction in the direction of the closest resistance at 1.1897 - 1.1909.

More:
https://fbs.com/analytics/articles/eur-usd-new-breakaway-gap-3955
 
GBP/USD: DEVELOPING "RECTANGLE" PATTERN
13:23 25.09.2017

1506345481-ff442a020314d890fd3423d26d82d517_1200x1200_q90v3.png


The price is still consolidating between the levels 1.3652 - 1.3444. It seems like bears are going to test the next support at 1.3479 - 1.3444. However, if a pullback from this area happens later on, bulls will probably try to reach the nearest resistance at 1.3618 - 1.3625.

1506345480-f869a95b8c22702923f9ea93f1afb203_1200x1200_q90v3.png


There's a possible developing "Rectangle" pattern, so the price is likely going to achieve the nearest support at 1.3444. Meanwhile, if we have a pullback from this level, we could have a bullish correction towards the closest resistance at 1.3618 - 1.3625.

More:
https://fbs.com/analytics/articles/gbp-usd-developing-rectangle-pattern-3956
 
EUR/USD: "WINDOW" REMAINS OPEN
13:51 25.09.2017

1506347426-916b3799b440804232a599ae404e75a4_1200x1200_q90v3.png


We've got a bearish "Harami", but the last "Window" remains open. So, the market is likely going to continue declining towards the nearest support. If any bullish pattern arrives later on, we could have an upward correction.

1506347426-37d6b506fccf3233ea15fc33130a7960_1200x1200_q90v3.png


The price reached the "Window", but there isn't any reversal pattern so far. Therefore, we could have just a local upward correction and a decline afterwards

More:
https://fbs.com/analytics/articles/eur-usd-window-remains-open-3957
 
USD/JPY: "SHOOTING STAR" PATTERN
13:54 25.09.2017

1506347426-bc7640d8fb960e2598eb8d367aca1492_1200x1200_q90v3.png


The upper "Window" has acted as resistance once again, so we've got a "Shooting Star". In this case, the market is likely going to test the nearest "Window", which could act as support.

1506347426-b9fc4f1b03a3fc96124572d05cc2b7a1_1200x1200_q90v3.png


We've got a "Hammer", which has been formed on the 34 Moving Average. So, bulls are likely going to test the closest "Window", which could be a departure point for a decline.

More:
https://fbs.com/analytics/articles/usd-jpy-shooting-star-pattern-3958
 
EUR/USD: BEARS IN GAME
07:30 26.09.2017

Technical levels: support – 1.1800, 1.1725; resistance – 1.1875.

Trade recommendations:

Buy — 1.1800; SL — 1.1780; TP1 — 1.1850; TP2 – 1.1875.
Reason: bearish Ichimoku Cloud with falling Senkou Span A; a new dead cross of Tenkan-sen and Kijun-sen with falling lines; the prices are entered into the negative area, but there is a strong support on 1.1800 and the market is oversold.

1506410990-5974574d0f06c411e972e24d898d2405_1200x1200_q90v3.png


More:
https://fbs.com/analytics/articles/eur-usd-bears-in-game-3972
 
USD/JPY: DOLLAR IS IN CORRECTION TO CLOUD
07:30 26.09.2017

Technical levels: support – 111.40, 111.10; resistance – 111.90, 112.20.

Trade recommendations:

Buy — 111.40; SL — 111.20; TP1 — 111.90; TP2 — 112.20.
Reason: bullish Ichimoku Cloud, but horizontal Senkou Span A and B; a golden cross of Tenkan-sen and Kijun-sen with narrow channel Tenkan-Kijun; the prices are breaking down the Kijun’s support and in correction local trend to the Cloud.

1506410990-3dcc4d3b0e9d38341d309e86e7227f36_1200x1200_q90v3.png


More:
https://fbs.com/analytics/articles/usd-jpy-dollar-is-in-correction-to-cloud-3973
 
EUR/USD: BEARS FACED WITH SUPPORT
07:59 26.09.2017

1506412634-518a639f396217f1f0f43f2bafe15d33_1200x1200_q90v3.png


The 89 Moving Average has been broken, so there's a new local low. In this case, the market is likely going to continue declining towards the nearest support at 1.1837 - 1.1822. If a pullback from this area happens, we could have an upward correction in the direction of the closest resistance at 1.1925 - 1.1952.

1506412633-d15d5370df0bb00edf4b7d098f705f35_1200x1200_q90v3.png


Bears faced with support at 1.1837, so the price is consolidating. Therefore, we should keep an eye on the nearest resistance at 1.1864 - 1.1874 as an intraday target. Meanwhile, if we have a pullback from these levels, bears will probably try to catch another support at 1.1837 - 1.1822.

More:
https://fbs.com/analytics/articles/eur-usd-bears-faced-with-support-3974
 
Top