FxGrow Daily Technical Analysis – 23rd Aug, 2016
By FxGrow Research & Analysis Team
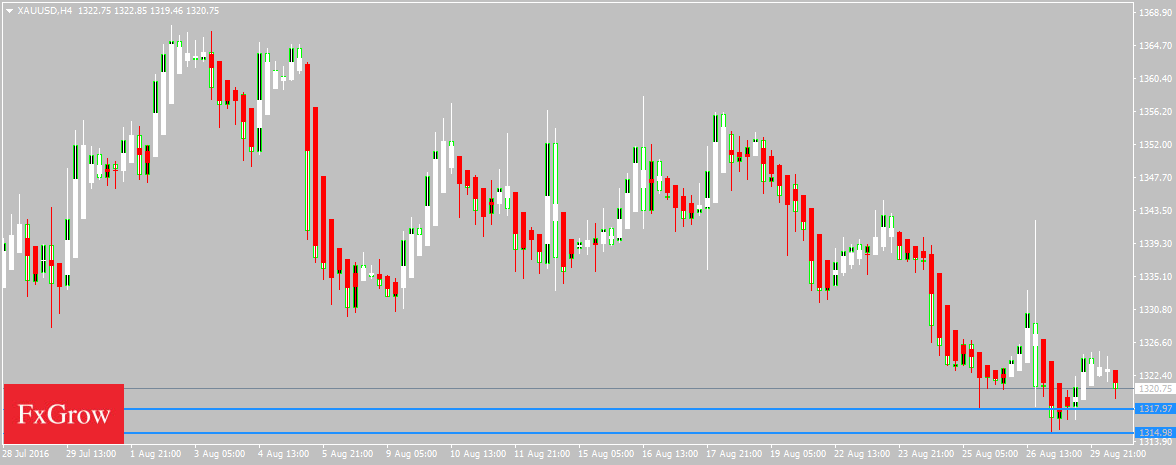
XAUUSD[Gold]
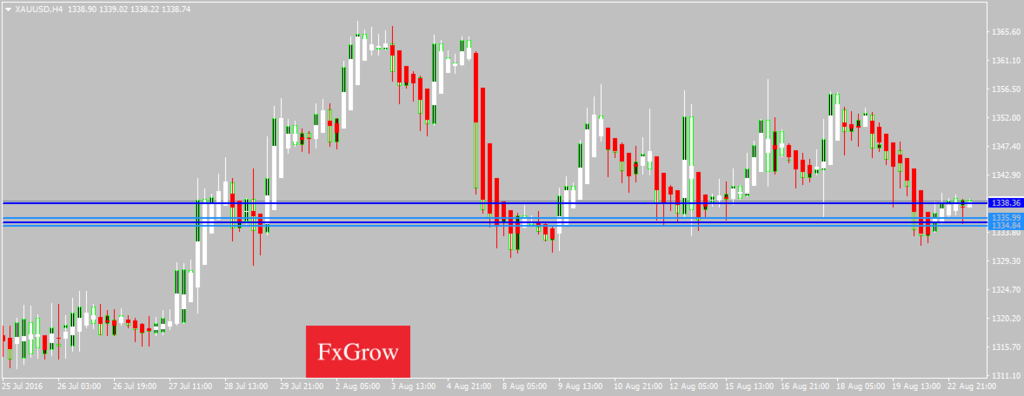
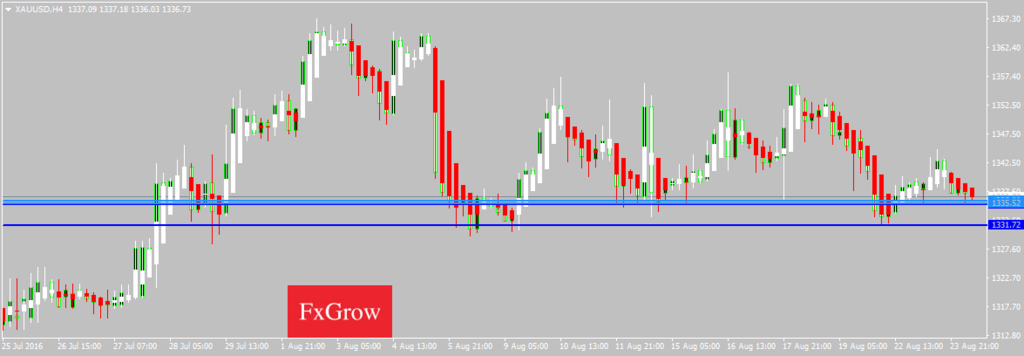
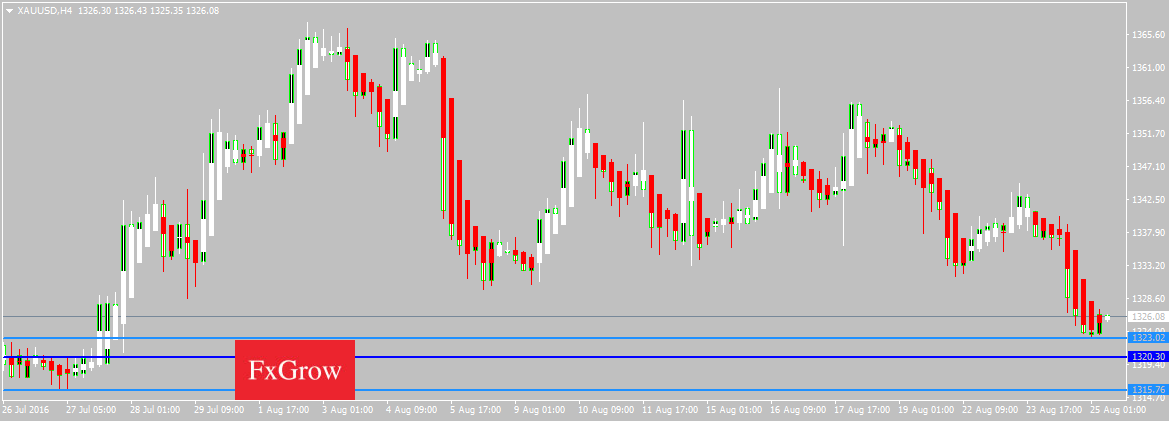
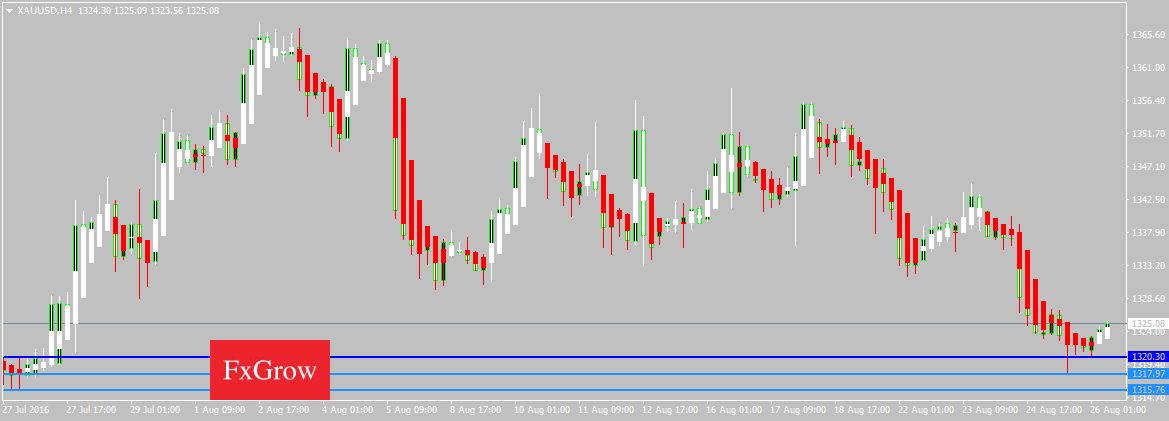
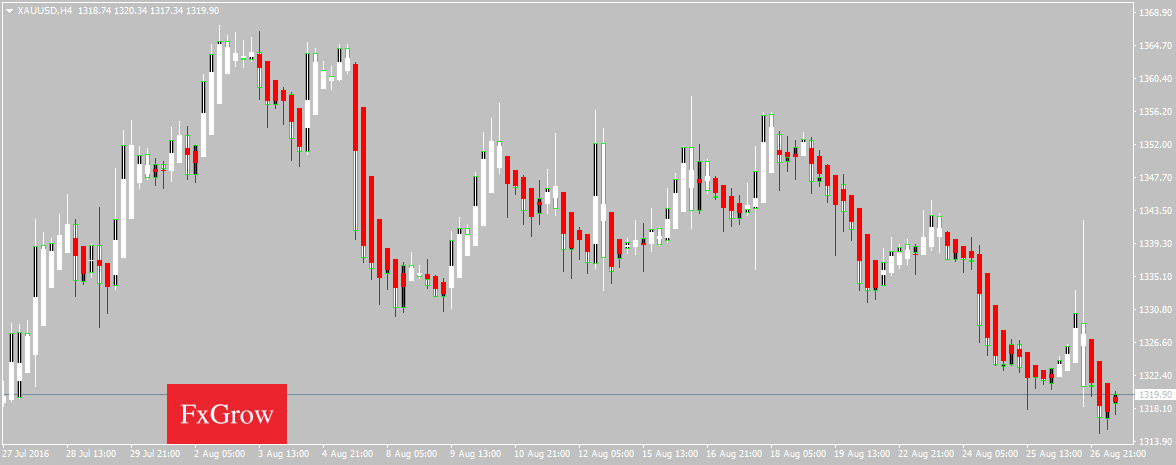
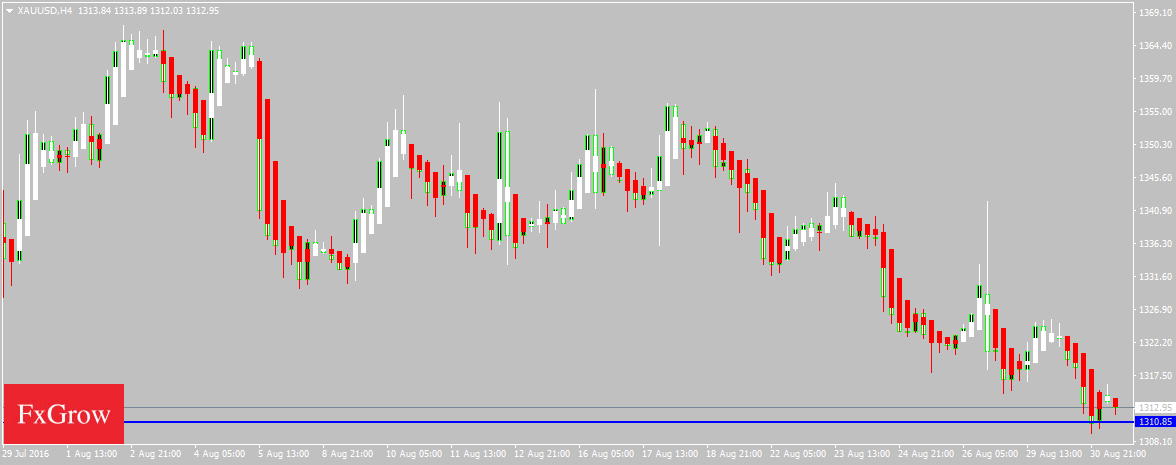
XAUUSD was indecisive yesterday as it touched a low of 1332.27 and a high of 1339.03 towards the end of the trading session. Gold is moving in a zigzag pattern and is now trading below its 100day SMA of 1348.55 in the Asian trading session. The near term bias is Neutral
Support is at 1340.70 while Resistance is at 1343.20 and 1344.45
23rd Aug 2016 – 06:33AM (UTC)
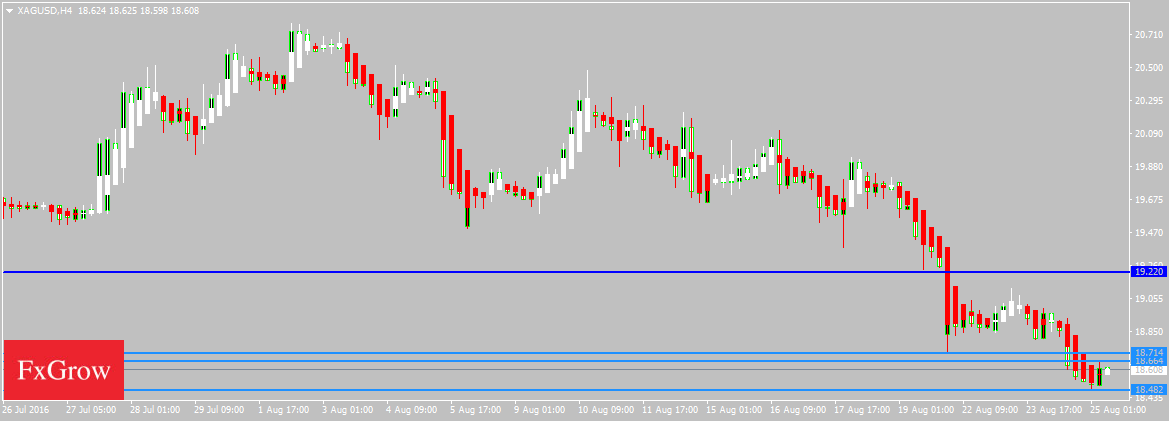
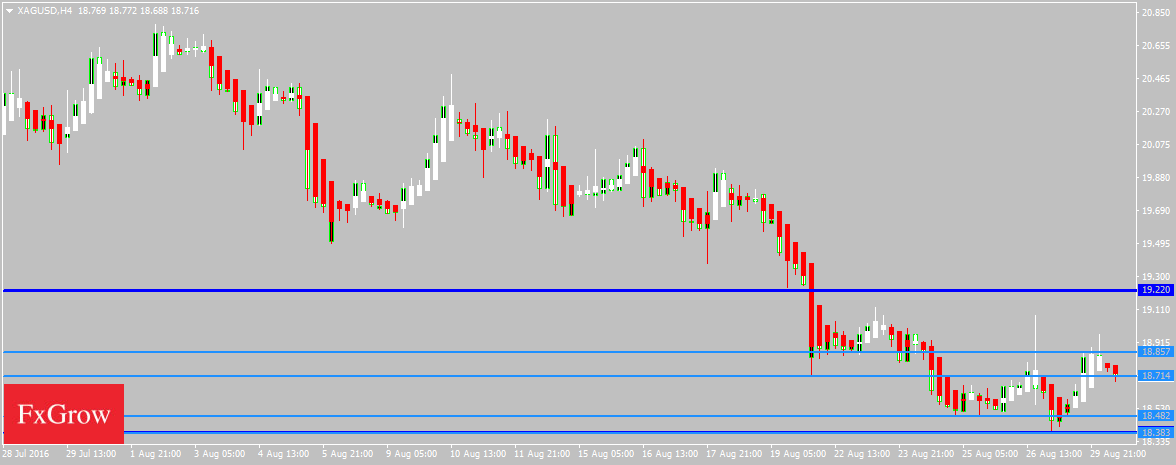
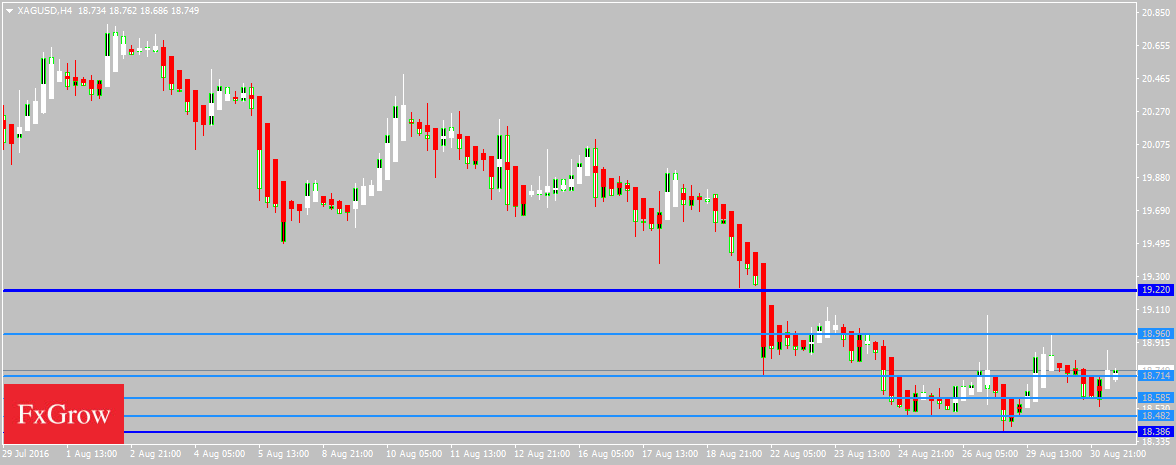
XAGUSD[Silver]
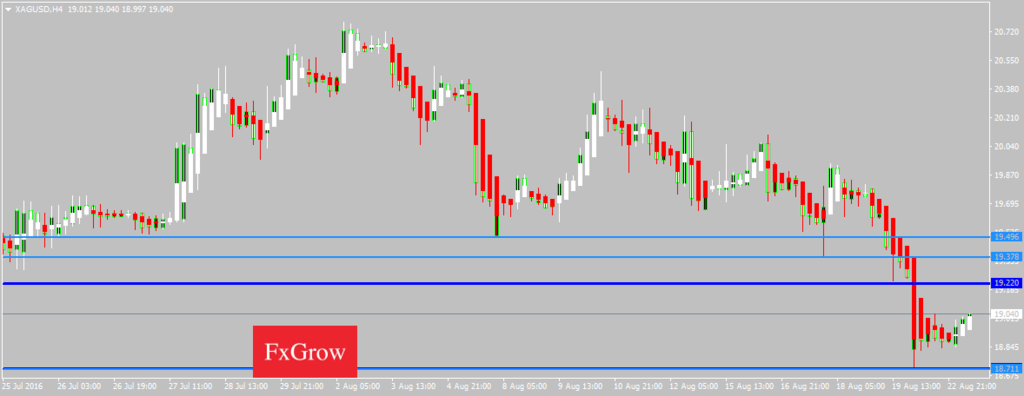
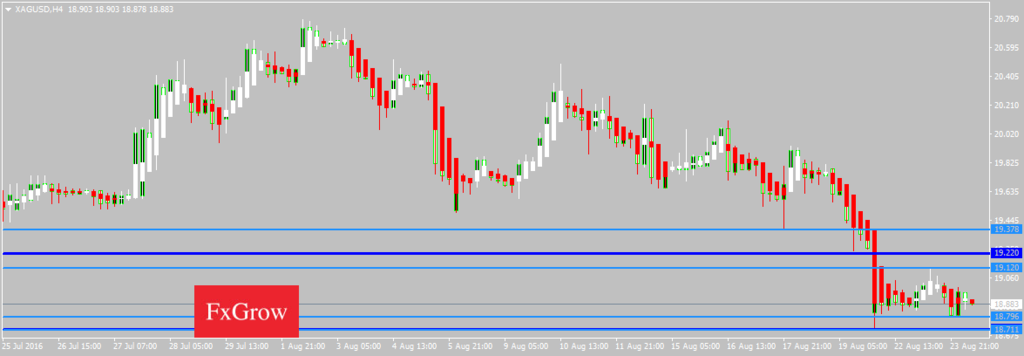
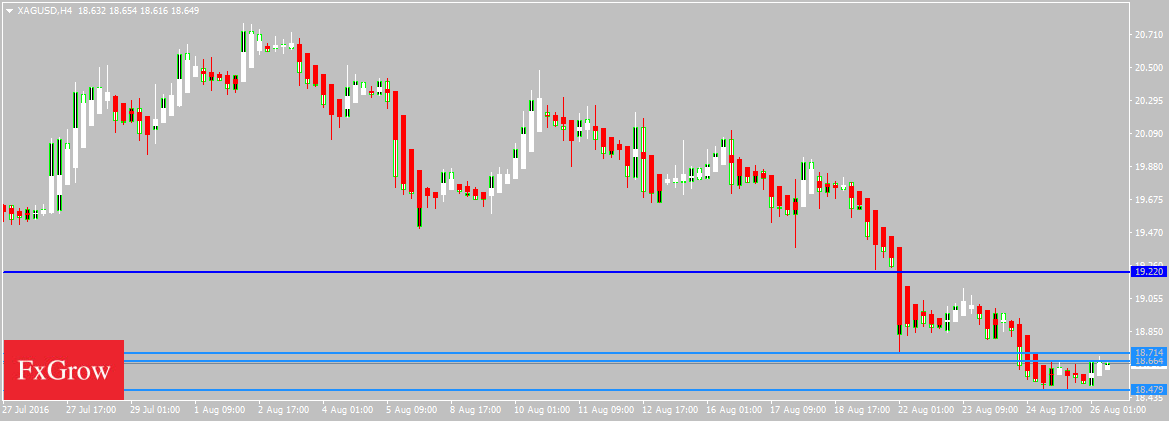
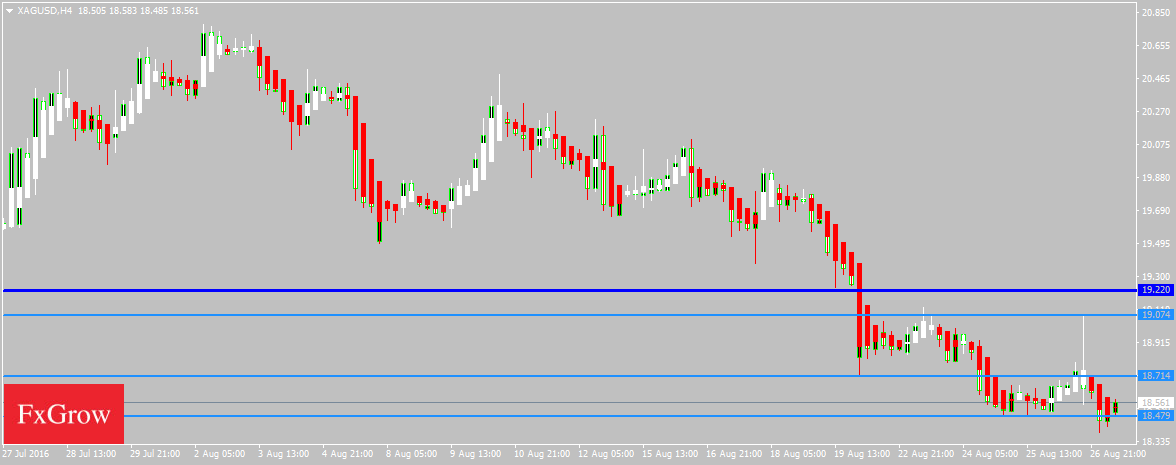
XAGUSD was bearish yesterday and remained below the 19.00 handle towards the end of the trading session. Silver is moving in a mild bullish tone and is now trading below its 100day SMA of 19.41 in the Asian trading session. The near term bias is Neutral to Bearish with targets of 18.75
RSI (14), STOCH (9, 6), STOCHRSI (14), MACD (12, 26), CCI (14), ROC indicate a SELL; ADX (14) is Neutral; while Average True Range (14) indicates Less Volatility.
Support is at 18.71 while Resistance is at 19.37 and 19.49
23rd Aug 2016 – 06:42AM (UTC)
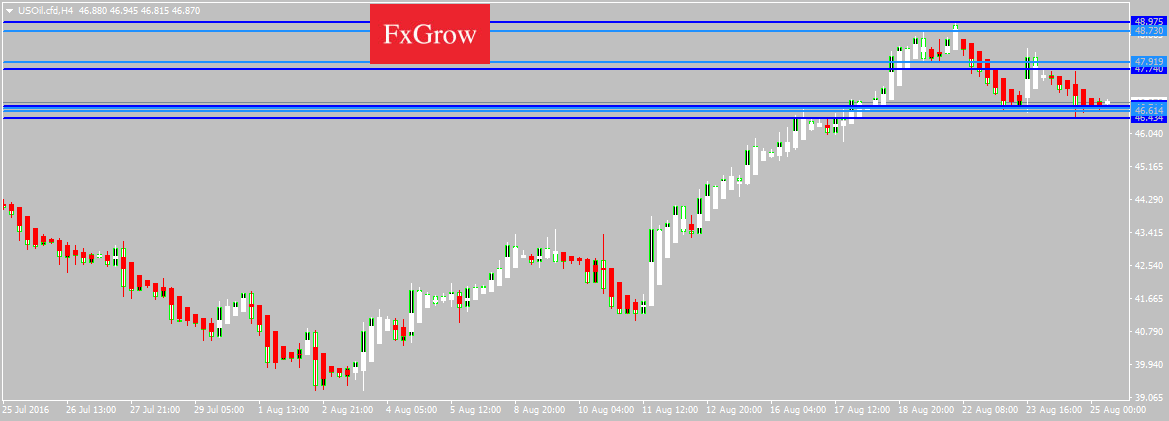
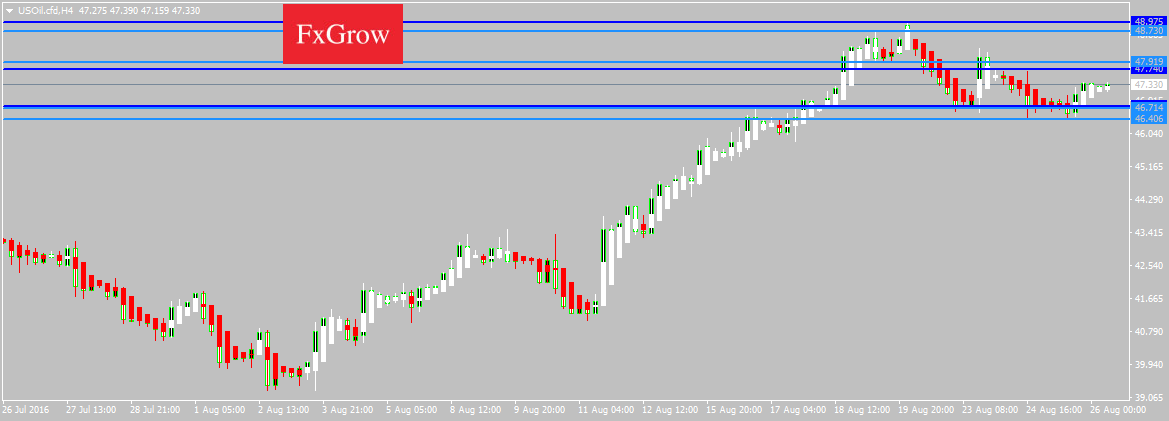
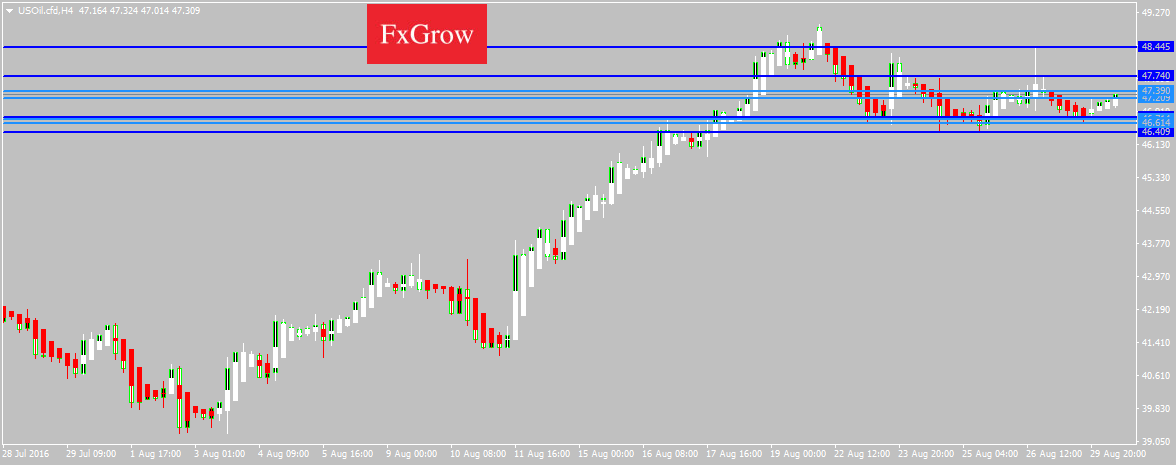
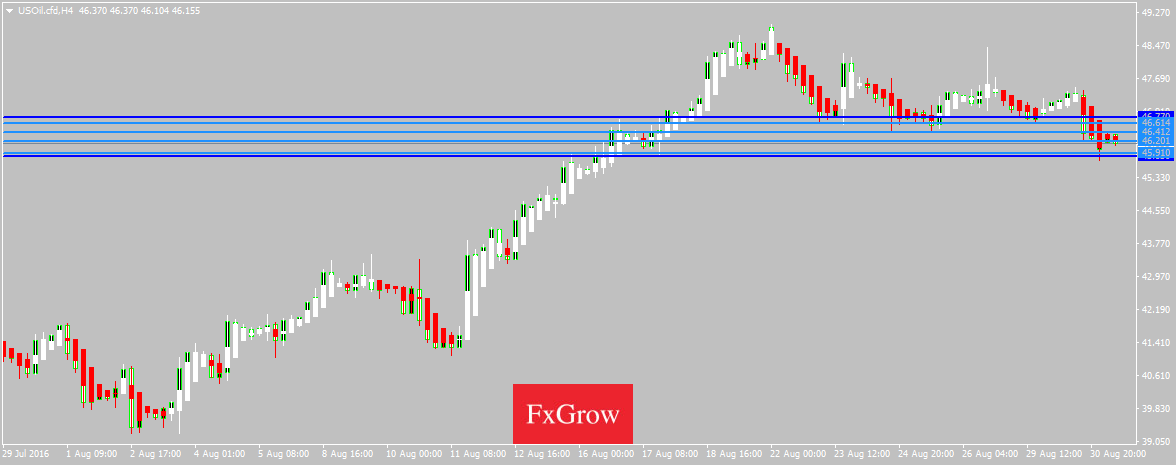
USOil.cfd
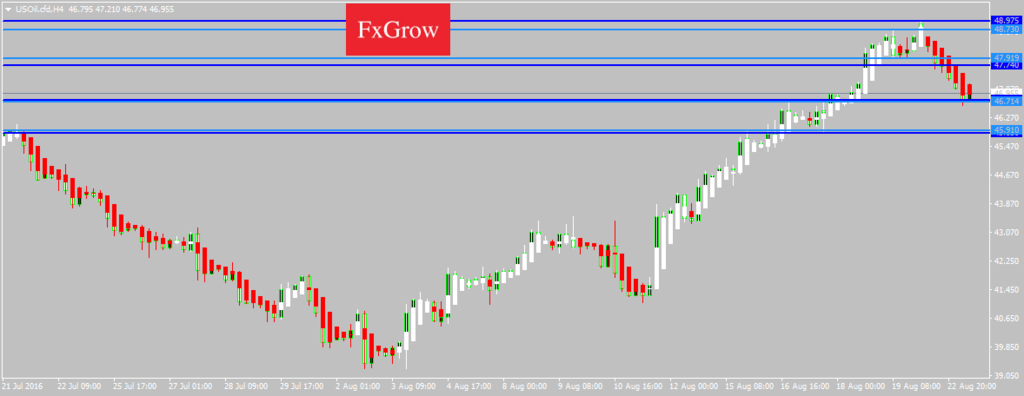
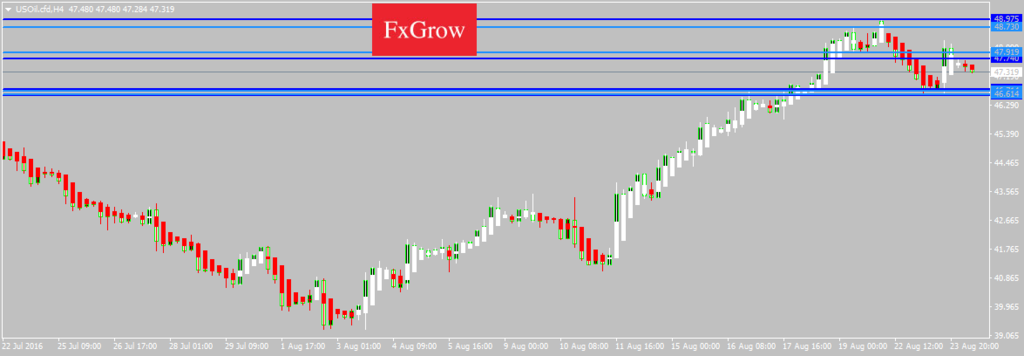
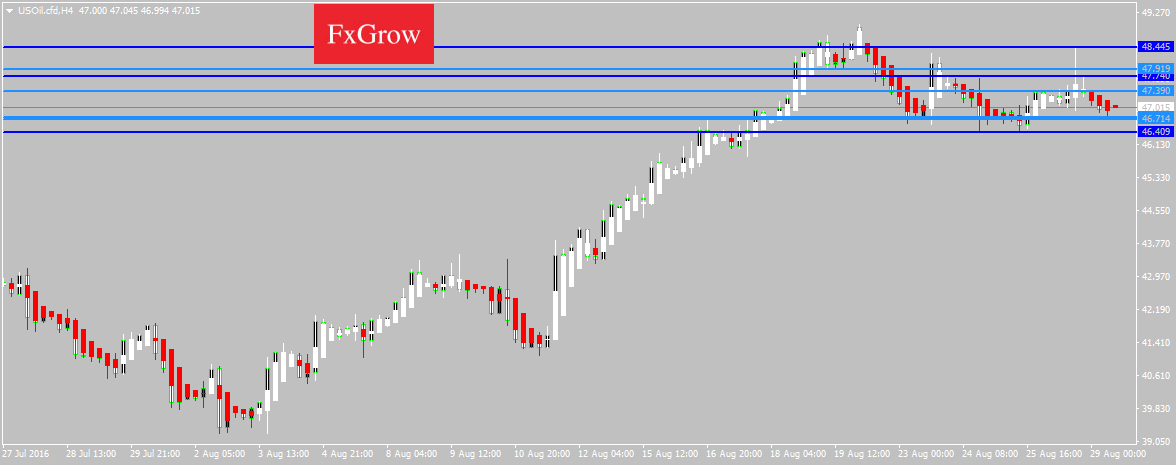
US Oil was bearish yesterday as it touched a low of 47.41 and remained weak towards the end of the trading session. US Oil is moving in a mild bearish tone and is now trading above its 100day SMA of 43.50 in the Asian trading session. The near term bias is Neutral to Bearish with targets of 46.50
STOCH (9, 6), ADX (14), CCI (14), Ultimate Oscillator, ROC indicate a SELL; RSI (14) is Neutral; STOCHRSI (14) is Oversold; while Average True Range (14) indicates Less Volatility.
Support is at 45.91 while Resistance is at 48.73 and 48.97
23rd Aug 2016 – 06:45AM (UTC)
For more in depth Research & Analysis please visit FxGrow.http://fxgrow.com/analysis-educatio...alysis-fxgrow-free-forex-analysis-tools#close
Note: This analysis is intended to provide general information and does not constitute the provision of INVESTMENT ADVICE. Investors should, before acting on this information, consider the appropriateness of this information having regard to their personal objectives, financial situation or needs. We recommend investors obtain investment advice specific to their situation before making any financial investment decision.
By FxGrow Research & Analysis Team
XAUUSD[Gold]
XAUUSD was indecisive yesterday as it touched a low of 1332.27 and a high of 1339.03 towards the end of the trading session. Gold is moving in a zigzag pattern and is now trading below its 100day SMA of 1348.55 in the Asian trading session. The near term bias is Neutral
Support is at 1340.70 while Resistance is at 1343.20 and 1344.45
23rd Aug 2016 – 06:33AM (UTC)
XAGUSD[Silver]
XAGUSD was bearish yesterday and remained below the 19.00 handle towards the end of the trading session. Silver is moving in a mild bullish tone and is now trading below its 100day SMA of 19.41 in the Asian trading session. The near term bias is Neutral to Bearish with targets of 18.75
RSI (14), STOCH (9, 6), STOCHRSI (14), MACD (12, 26), CCI (14), ROC indicate a SELL; ADX (14) is Neutral; while Average True Range (14) indicates Less Volatility.
Support is at 18.71 while Resistance is at 19.37 and 19.49
23rd Aug 2016 – 06:42AM (UTC)
USOil.cfd
US Oil was bearish yesterday as it touched a low of 47.41 and remained weak towards the end of the trading session. US Oil is moving in a mild bearish tone and is now trading above its 100day SMA of 43.50 in the Asian trading session. The near term bias is Neutral to Bearish with targets of 46.50
STOCH (9, 6), ADX (14), CCI (14), Ultimate Oscillator, ROC indicate a SELL; RSI (14) is Neutral; STOCHRSI (14) is Oversold; while Average True Range (14) indicates Less Volatility.
Support is at 45.91 while Resistance is at 48.73 and 48.97
23rd Aug 2016 – 06:45AM (UTC)
For more in depth Research & Analysis please visit FxGrow.http://fxgrow.com/analysis-educatio...alysis-fxgrow-free-forex-analysis-tools#close
Note: This analysis is intended to provide general information and does not constitute the provision of INVESTMENT ADVICE. Investors should, before acting on this information, consider the appropriateness of this information having regard to their personal objectives, financial situation or needs. We recommend investors obtain investment advice specific to their situation before making any financial investment decision.