• The Forex, Binary Options Forum - welcomes you to our Community!

    DigitalCashPalace Forum is dedicated to discussions about Forex, Binary Options, commodities, stocks related.

    Please take a look around, and feel free to .

Daily Technical Analysis by FxGrow

FxGrow Daily Technical Analysis – 01st Feb , 2016
By FxGrow Research & Analysis Team

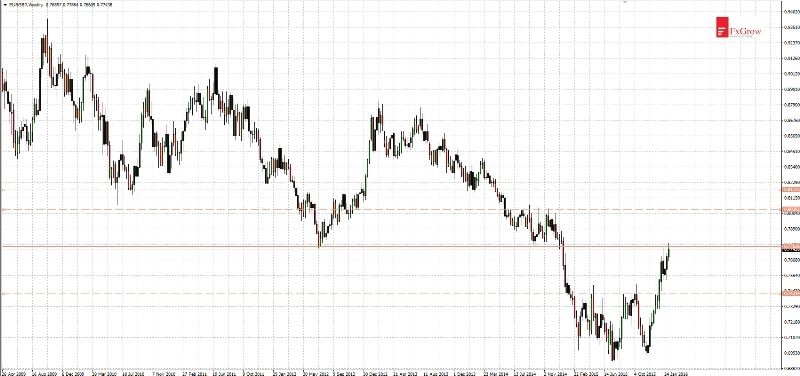
GBPNOK - very good moment for a rebound

GBPNOK reached important support and rebound attempt occurred once again. Admittedly, since March 2013 price moves in an uptrend, however for the last 3 months we clearly saw troubles of demand with further upward movement. Last high was reached in November 5, since then GBPNOK falls.

To read this Full in depth Analysis please visit FxGrowhttp://www.fxgrow.com/analysis-educ...cal-analysis-fxgrow-free-forex-analysis-tools.

Note: This analysis is intended to provide general information and does not constitute the provision of INVESTMENT ADVICE. Investors should, before acting on this information, consider the appropriateness of this information having regard to their personal objectives, financial situation or needs. We recommend investors obtain investment advice specific to their situation before making any financial investment decision.
 
FxGrow Daily Technical Analysis – 02nd Feb, 2016
By FxGrow Research & Analysis Team

OIL brent - near key level above support

In previous analysis I indicated target for upward movement 36.00, I wrote: "rebounds at OIL were usually dynamic so while the key levels weren't broken current movement should be seen as a correction. Key resistances are at levels: 36.00 (former support that stopped declines in December) and 42.50".

To read this Full in depth Analysis please visit FxGrowhttp://www.fxgrow.com/analysis-educ...cal-analysis-fxgrow-free-forex-analysis-tools.

Note: This analysis is intended to provide general information and does not constitute the provision of INVESTMENT ADVICE. Investors should, before acting on this information, consider the appropriateness of this information having regard to their personal objectives, financial situation or needs. We recommend investors obtain investment advice specific to their situation before making any financial investment decision.
 
FxGrow Daily Technical Analysis – 02nd Feb, 2016
By FxGrow Research & Analysis Team

EURUSD - another attempt of break above bearish regression channel

Demand on EURUSD definitely catched the wind. Since a week supply wasn't able to cross 1.0800 level, beside this last two days show constant upward movement. Currently price broke above bearish regression channel in which price moved since December 4.

To read this Full in depth Analysis please visit FxGrowhttp://www.fxgrow.com/analysis-educ...cal-analysis-fxgrow-free-forex-analysis-tools.

Note: This analysis is intended to provide general information and does not constitute the provision of INVESTMENT ADVICE. Investors should, before acting on this information, consider the appropriateness of this information having regard to their personal objectives, financial situation or needs. We recommend investors obtain investment advice specific to their situation before making any financial investment decision.
 
FxGrow Daily Technical Analysis – 03rd Feb, 2016
By FxGrow Research & Analysis Team

GBPUSD - Inside upward channel
After rebound on January from 6-years low, GBPUSD continues upward movement. Since two weeks it moves in bullish regression channel. Before new uptrend impulse occurs, it is likely that price will move to the lower limit of that channel (area 1.4200). Further upward movement should be continued - current rebound didn't reach even a basic Fibonacci 38,2% level (area 1.4520) of previous downward movement.

To read this Full in depth Analysis please visit FxGrowhttp://www.fxgrow.com/analysis-educ...cal-analysis-fxgrow-free-forex-analysis-tools.

Note: This analysis is intended to provide general information and does not constitute the provision of INVESTMENT ADVICE. Investors should, before acting on this information, consider the appropriateness of this information having regard to their personal objectives, financial situation or needs. We recommend investors obtain investment advice specific to their situation before making any financial investment decision.
 
FxGrow Daily Technical Analysis – 03rd Feb, 2016
By FxGrow Research & Analysis Team

NZDCAD - rebound after uptrend line test

NZDCAD looks very interesting. From September to December 2015 price moved in an uptrend. In the end of December correction occurred which continues till today. Downward movement took a shape of ABC simple correction and particular points can be marked already. There isn't perfect equal A = C, but other elements should help with further upward movement.

To read this Full in depth Analysis please visit FxGrowhttp://www.fxgrow.com/analysis-educ...cal-analysis-fxgrow-free-forex-analysis-tools.

Note: This analysis is intended to provide general information and does not constitute the provision of INVESTMENT ADVICE. Investors should, before acting on this information, consider the appropriateness of this information having regard to their personal objectives, financial situation or needs. We recommend investors obtain investment advice specific to their situation before making any financial investment decision.
 
FxGrow Daily Technical Analysis – 04th Feb, 2016
By FxGrow Research & Analysis Team

USDJPY - Sharp declines after completed reverse H&S pattern

Such technical price behaviour like last USDJPY movement can't be seen very often. First it formed reverse head and shoulders pattern and BoJ decision was an excuse for upward movement. Target for that movement coincides almost perfectly with reverse H&S potential target (it can be measured by range between the top of the head and neckline). USDJPY after reaching the target begun declines immediately and support at 118.80 didn't stop the price even for a moment.

To read this Full in depth Analysis please visit FxGrowhttp://www.fxgrow.com/analysis-educ...cal-analysis-fxgrow-free-forex-analysis-tools.

Note: This analysis is intended to provide general information and does not constitute the provision of INVESTMENT ADVICE. Investors should, before acting on this information, consider the appropriateness of this information having regard to their personal objectives, financial situation or needs. We recommend investors obtain investment advice specific to their situation before making any financial investment decision.
 
FxGrow Daily Technical Analysis – 04th Feb, 2016
By FxGrow Research & Analysis Team

GBPCAD - huge volatility after BoE decision

Today huge volatility occurred at currency pairs with GBP. It was caused by BoE decision on interest rates. That decision was consistent with forecasts which mean interest rates stayed at the same level. There were a hesitance on the market and just after decision GBPCAD sharply fell to the 1.9890 level and as quickly rebounded. That level was three months support. BoE statement was unequivocal from one side rates hike is possible and from the other lowered the forecast for inflation.

To read this Full in depth Analysis please visit FxGrowhttp://www.fxgrow.com/analysis-educ...cal-analysis-fxgrow-free-forex-analysis-tools.

Note: This analysis is intended to provide general information and does not constitute the provision of INVESTMENT ADVICE. Investors should, before acting on this information, consider the appropriateness of this information having regard to their personal objectives, financial situation or needs. We recommend investors obtain investment advice specific to their situation before making any financial investment decision.
 
FxGrow Daily Technical Analysis – 05th Feb, 2016
By FxGrow Research & Analysis Team

EURUSD - movement in 1.1500 direction, watch out on today's U.S. nonfarm payrolls

Roaring success of the bulls at EURUSD is in full swing. After broke above bearish regression channel price also broke resistances at 1.1050 and 1.1120. Next resistance is at 1.1350 however it looks like the goal for demand is at 1.1500. That level is the upper limit of big channel in which price moved since 12 months. Only once during last year that level was exceeded for two days.

To read this Full in depth Analysis please visit FxGrowhttp://www.fxgrow.com/analysis-educ...cal-analysis-fxgrow-free-forex-analysis-tools.

Note: This analysis is intended to provide general information and does not constitute the provision of INVESTMENT ADVICE. Investors should, before acting on this information, consider the appropriateness of this information having regard to their personal objectives, financial situation or needs. We recommend investors obtain investment advice specific to their situation before making any financial investment decision.
 
FxGrow Daily Technical Analysis – 05th Feb, 2016
By FxGrow Research & Analysis Team

GBPUSD - declines after U.S. nonfarm payrolls readings

After macroeconomic reading of U.S. nonfarm payrolls dollar strengthened. EURUSD and GBPUSD declined, but more interesting situation can be seen at GBPUSD. Nonfarm payrolls grew 151K in January, however that reading is almost 20% worse than the forecast. From the other side the unemployment rate edged down to 4.9% (what is also different from forecasts).

To read this Full in depth Analysis please visit FxGrowhttp://www.fxgrow.com/analysis-educ...cal-analysis-fxgrow-free-forex-analysis-tools.

Note: This analysis is intended to provide general information and does not constitute the provision of INVESTMENT ADVICE. Investors should, before acting on this information, consider the appropriateness of this information having regard to their personal objectives, financial situation or needs. We recommend investors obtain investment advice specific to their situation before making any financial investment decision.
 
FxGrow Daily Technical Analysis – 08th Feb, 2016
By FxGrow Research & Analysis Team

EUR/USD - technical analysis of popular major

In last Thursday we could spot an attempt to break the 1,1250 area, where at least two Fibonacci levels are located. First one is the 61.8% of 24th August bear move - price didn't really test it, but it was really close. Second resistance is a 100% level from the 100% pattern. Measuring the corrective move from 3rd of December we can draw the resistance line right in the place of reversal. This line was perfectly tested by the price and market reaction was perfect as well.

To read this Full in depth Analysis please visit FxGrowhttp://www.fxgrow.com/analysis-educ...cal-analysis-fxgrow-free-forex-analysis-tools.

Note: This analysis is intended to provide general information and does not constitute the provision of INVESTMENT ADVICE. Investors should, before acting on this information, consider the appropriateness of this information having regard to their personal objectives, financial situation or needs. We recommend investors obtain investment advice specific to their situation before making any financial investment decision.
 
FxGrow Daily Technical Analysis – 08th Feb, 2016
By FxGrow Research & Analysis Team

EUR/PLN – significant suport + weekly LONG signal

Single currency to Polish zloty moved above 4.3894 and 38.2% Fibonacci retracement (upward move from December lows) during few last session. Horizontal level had an important role at the end of 2014 – and now acts as the support. Monday’s session brings stronger reflection and move above 4.4300.
2i6ko4l.jpg


To read this Full in depth Analysis please visit FxGrowhttp://www.fxgrow.com/analysis-educ...cal-analysis-fxgrow-free-forex-analysis-tools.

Note: This analysis is intended to provide general information and does not constitute the provision of INVESTMENT ADVICE. Investors should, before acting on this information, consider the appropriateness of this information having regard to their personal objectives, financial situation or needs. We recommend investors obtain investment advice specific to their situation before making any financial investment decision.
 
FxGrow Daily Technical Analysis – 09th Feb, 2016
By FxGrow Research & Analysis Team

EURGBP - highest since a year and test of important resistance

Since a mid-November EURGBP moved in an uptrend. Currently demand has a tough work to do, which is break above resistance at 0.7760. If it succeeds price should gain 250 pips and reach another resistance 0.8030. However if supply is stronger nearest supports will be located at levels: 0.7540, 0.7420.
2016-02-09_analysis_EURGBP-W1_zpsbjktoqno.jpg


To read this Full in depth Analysis please visit FxGrowhttp://www.fxgrow.com/analysis-educ...cal-analysis-fxgrow-free-forex-analysis-tools.

Note: This analysis is intended to provide general information and does not constitute the provision of INVESTMENT ADVICE. Investors should, before acting on this information, consider the appropriateness of this information having regard to their personal objectives, financial situation or needs. We recommend investors obtain investment advice specific to their situation before making any financial investment decision.
 
FxGrow Daily Technical Analysis – 09th Feb, 2016
By FxGrow Research & Analysis Team

USDJPY - new week, new low

There is a black scenario in game at USDJPY and today price reached 14-months low. It have to be noted that such scenario was indicated in the last week's analysis. I wrote: "Currently price should continue previous declines. Nearest support is at 116.70 but even this year's low at 116.10 could be tested".

To read this Full in depth Analysis please visit FxGrowhttp://www.fxgrow.com/analysis-educ...cal-analysis-fxgrow-free-forex-analysis-tools.

Note: This analysis is intended to provide general information and does not constitute the provision of INVESTMENT ADVICE. Investors should, before acting on this information, consider the appropriateness of this information having regard to their personal objectives, financial situation or needs. We recommend investors obtain investment advice specific to their situation before making any financial investment decision.
 
FxGrow Daily Technical Analysis – 10th Feb, 2016
By FxGrow Research & Analysis Team

AUDCAD - rebound from support near 0.9730

Since the beginning of January AUDCAD moved down. In this particular time support at area 0.9820 - 0.9840 stopped declines. Yesterday this support was broken below and price sharply fell 100 pips reaching 0.9730. Support at 0.9730 is very strong, it can be seen at weekly TF. Price rebounded at indicated level and upward movement continues today.


To read this Full in depth Analysis please visit FxGrowhttp://www.fxgrow.com/analysis-educ...cal-analysis-fxgrow-free-forex-analysis-tools.

Note: This analysis is intended to provide general information and does not constitute the provision of INVESTMENT ADVICE. Investors should, before acting on this information, consider the appropriateness of this information having regard to their personal objectives, financial situation or needs. We recommend investors obtain investment advice specific to their situation before making any financial investment decision.
 
FxGrow Daily Technical Analysis – 10th Feb, 2016
By FxGrow Research & Analysis Team

Oil brent at support 30.50

Rebound which lasted 10 days is now only a memory and oil returned to downtrend. So far price stayed above 30.00 level however there isn't any optimistic sign for the bulls. It is likely that side trend between 27.30 and 36.10 will be continued. In this area price moved since a month.

To read this Full in depth Analysis please visit FxGrowhttp://www.fxgrow.com/analysis-educ...cal-analysis-fxgrow-free-forex-analysis-tools.

Note: This analysis is intended to provide general information and does not constitute the provision of INVESTMENT ADVICE. Investors should, before acting on this information, consider the appropriateness of this information having regard to their personal objectives, financial situation or needs. We recommend investors obtain investment advice specific to their situation before making any financial investment decision.
 
FxGrow Daily Technical Analysis – 11th Feb, 2016
By FxGrow Research & Analysis Team

EURUSD - highest since October 2015

During semi-annual congressional testimony Janet Yellen wasn't dovish enough, she said: "The FOMC anticipates that economic conditions will evolve in a manner that will warrant only gradual increases in the federal funds rate".

Time-frame D1
2016-02-11_analiza_EURUSD-D1_zpssxhfrjux.jpg


To read this Full in depth Analysis please visit FxGrowhttp://www.fxgrow.com/analysis-educ...cal-analysis-fxgrow-free-forex-analysis-tools.

Note: This analysis is intended to provide general information and does not constitute the provision of INVESTMENT ADVICE. Investors should, before acting on this information, consider the appropriateness of this information having regard to their personal objectives, financial situation or needs. We recommend investors obtain investment advice specific to their situation before making any financial investment decision.
 
FxGrow Daily Technical Analysis – 11th Feb, 2016
By FxGrow Research & Analysis Team

USDCAD - bulls are back, but a flag pattern suggests that the falls are not finished

After correction of 50% previous upward movement, at the chart occurred a candle with long bottom shadow. Such price action candles predict rebound. So it happened and for a week upward movement continues. However there is one concern. At time-frame H4 price formed flag pattern in a direction opposite to the previous movement (blue on the chart).


Time-frame D1
2016-02-11_analiza_USDCAD-D1_zps2dx8xnxk.jpg


To read this Full in depth Analysis please visit FxGrowhttp://www.fxgrow.com/analysis-educ...cal-analysis-fxgrow-free-forex-analysis-tools.

Note: This analysis is intended to provide general information and does not constitute the provision of INVESTMENT ADVICE. Investors should, before acting on this information, consider the appropriateness of this information having regard to their personal objectives, financial situation or needs. We recommend investors obtain investment advice specific to their situation before making any financial investment decision.
 
FxGrow Daily Technical Analysis – 12th Feb, 2016
By FxGrow Research & Analysis Team

USDJPY - after 9 days of declines there is a hope for a rebound

Previous AUDJPY analysis was very profitable. I indicated flag pattern and direction of breakout. I wrote: 'Flag is a pattern of trend continuation which means that price should break below lower limit of the flag according to a main downtrend'. As you can see breakout occurred and price sharply moved down. After rebound, since mid-January decline continues and yesterday price tested support at 77.60.

To read this Full in depth Analysis please visit FxGrowhttp://www.fxgrow.com/analysis-educ...cal-analysis-fxgrow-free-forex-analysis-tools.

Note: This analysis is intended to provide general information and does not constitute the provision of INVESTMENT ADVICE. Investors should, before acting on this information, consider the appropriateness of this information having regard to their personal objectives, financial situation or needs. We recommend investors obtain investment advice specific to their situation before making any financial investment decision.
 
FxGrow Daily Technical Analysis – 12th Feb, 2016
By FxGrow Research & Analysis Team

EURCAD - correction should occur

Macroeconomic data from US caused sharp downward movement at EURCAD. Rebound occurred when price moved above 1.5580 area which is nearest support. US retail sales were better than forecasted. Similar price reaction occurred at EURUSD.

To read this Full in depth Analysis please visit FxGrowhttp://www.fxgrow.com/analysis-educ...cal-analysis-fxgrow-free-forex-analysis-tools.

Note: This analysis is intended to provide general information and does not constitute the provision of INVESTMENT ADVICE. Investors should, before acting on this information, consider the appropriateness of this information having regard to their personal objectives, financial situation or needs. We recommend investors obtain investment advice specific to their situation before making any financial investment decision.
 
FxGrow Daily Technical Analysis – 13th Feb, 2016
By FxGrow Research & Analysis Team

EURUSD - movement towards 1.1160 support

Supply at EURUSD took over control after Thursday's test of resistance at 1.1380. First support at 1.1320 wasn't able to stop decline and today for the first minutes of trading downward movement is continuing. Nearest support is at 1.1160 but if it breaks stronger support will be located at 1.1100. One of that levels should make rebound.

To read this Full in depth Analysis please visit FxGrowhttp://www.fxgrow.com/analysis-educ...cal-analysis-fxgrow-free-forex-analysis-tools.

Note: This analysis is intended to provide general information and does not constitute the provision of INVESTMENT ADVICE. Investors should, before acting on this information, consider the appropriateness of this information having regard to their personal objectives, financial situation or needs. We recommend investors obtain investment advice specific to their situation before making any financial investment decision.
 
Top